It has been a couple of weeks since the City of Calgary released the new data for 2025. We have been working hard to integrate this fresh data into our system, and we are excited to announce that it is now live on our platform. The update includes the 2025 property assessment values along with building and development permits within the property value lens. We have also updated local crime and traffic incident data with the most recent statistics for 2024 in our safety lens. Finally, our points of interest data has been refreshed with the latest information for 2025.
This means you can now explore the most up-to-date information about your neighbourhood, including the latest property values, crime rates, traffic incidents, and points of interest. Below is a breakdown of the new data.
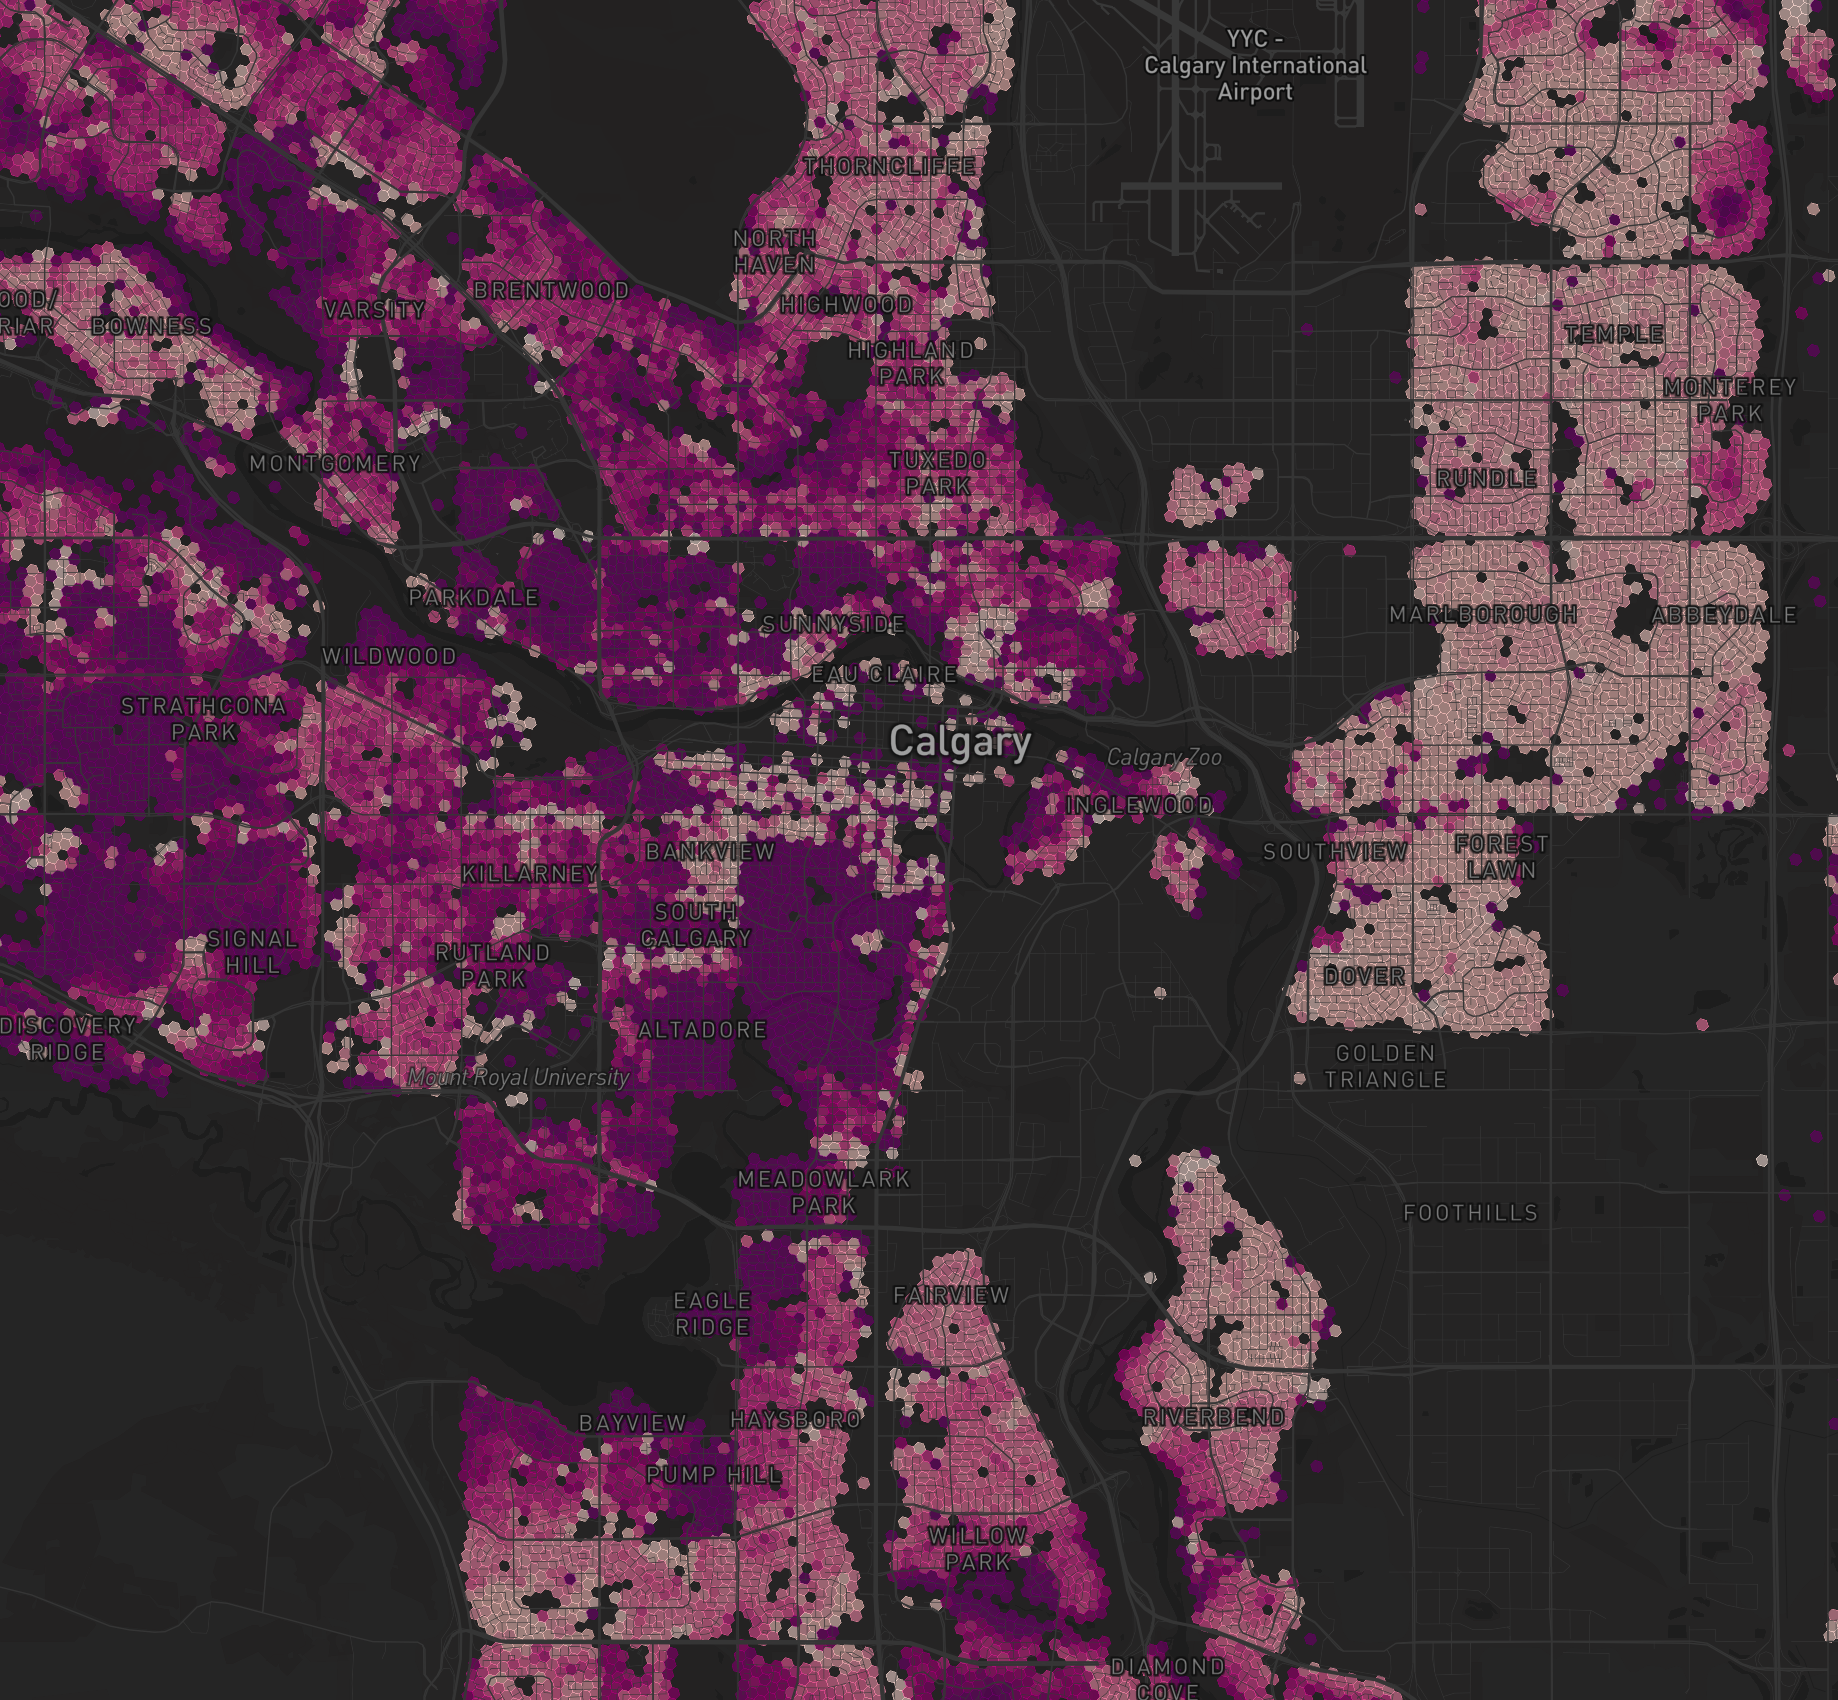
Property Assessment Values
We source our data from the City of Calgary's property assessment database, which represents the city's assessed value of properties for tax purposes. While assessment values don't directly reflect market values or sale prices, they serve as a useful relative metric for understanding growth patterns and value changes across different areas and property types in the city. Assessment values typically consider factors such as property characteristics, location, and general market conditions, though they may differ from actual market values due to the methodologies and timing of assessments.
The 2025 data shows an average increase of 19% in property assessments year-over-year, with over 44% of properties experiencing increases exceeding 15%. In addition:
- The largest segment (30%) of properties experienced an increase between 10-15%.
- 27% of properties saw an increase between 15-20%.
- 17% of properties experienced high increase rates exceeding 20%.

Crime and Traffic Incident Data
We have updated the crime and traffic incident data to include the most recent statistics for 2024, sourced from the Calgary Police Service. This data provides insights into the safety of different neighbourhoods across the city. The crime data covers various types of criminal activities reported in the city, while the traffic incident data captures information on collisions and other traffic-related events involving vehicles, cyclists, pedestrians, and trains.
The updated data shows that crime rates decreased by 22% year-over-year, with a notable decline in commercial robbery incidents. Traffic incidents, on the other hand, increased by an average of 26%, with incidents involving trains and pedestrians rising by 97% and 51% year-over-year, respectively. Conversely, incidents involving cyclists decreased by 13% compared to the previous year.

Points of Interest Data
We have refreshed our points of interest data to include the latest information for 2025. Our database now contains approximately 300,000 data points for the City of Calgary, covering a wide range of amenities, services, and attractions. Points of interest include schools, parks, restaurants, shopping centers, recreation facilities, and more. By analyzing the distribution and proximity of these points, you can gain valuable insights into the accessibility and convenience of different neighbourhoods.

Next Steps
Explore the new data on our platform to see how property assessment values, crime rates, traffic incidents, and points of interest have changed in your neighbourhood. Use our interactive maps, charts, and filters to compare different areas, track trends over time, and make informed decisions about real estate, safety, and lifestyle in Calgary. Stay tuned for more updates and new features coming soon!
Ready to explore neighborhoods?
Search any address and see real data — safety, schools, values, and more.
Start Chatting Free