Explore Local Crime, Street Lighting, and Traffic Safety with New Metrics
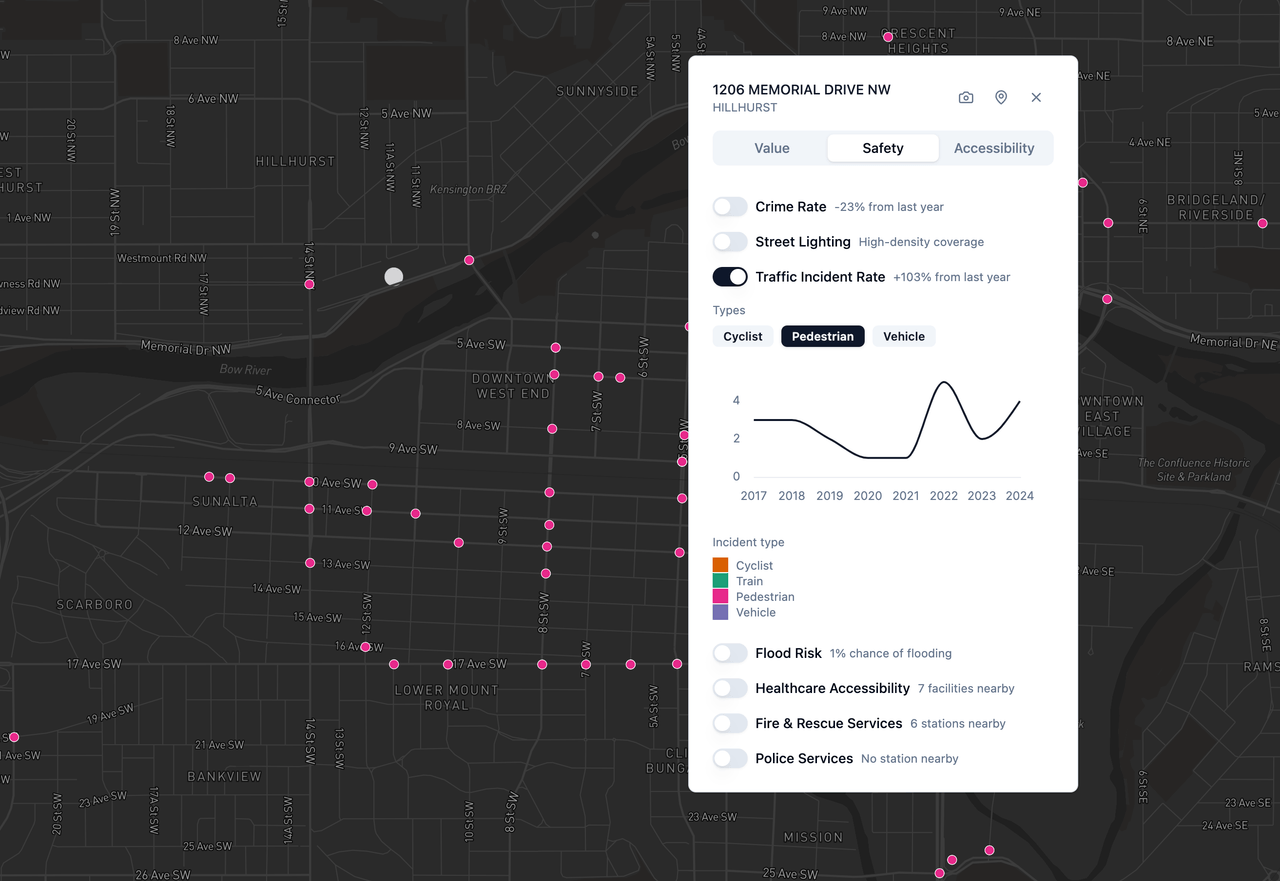
When searching for a new place to live, safety consistently ranks as one of the top priorities for individuals and families alike. Whether walking home at night, letting your children play outside, or commuting by bike, feeling secure in your neighbourhood is essential to your quality of life. That's why I'm excited to announce a significant update to PickYourPlace, introducing new safety metrics that will help you make more confident decisions about your next neighbourhood.
Enhanced Crime Rate Visualization
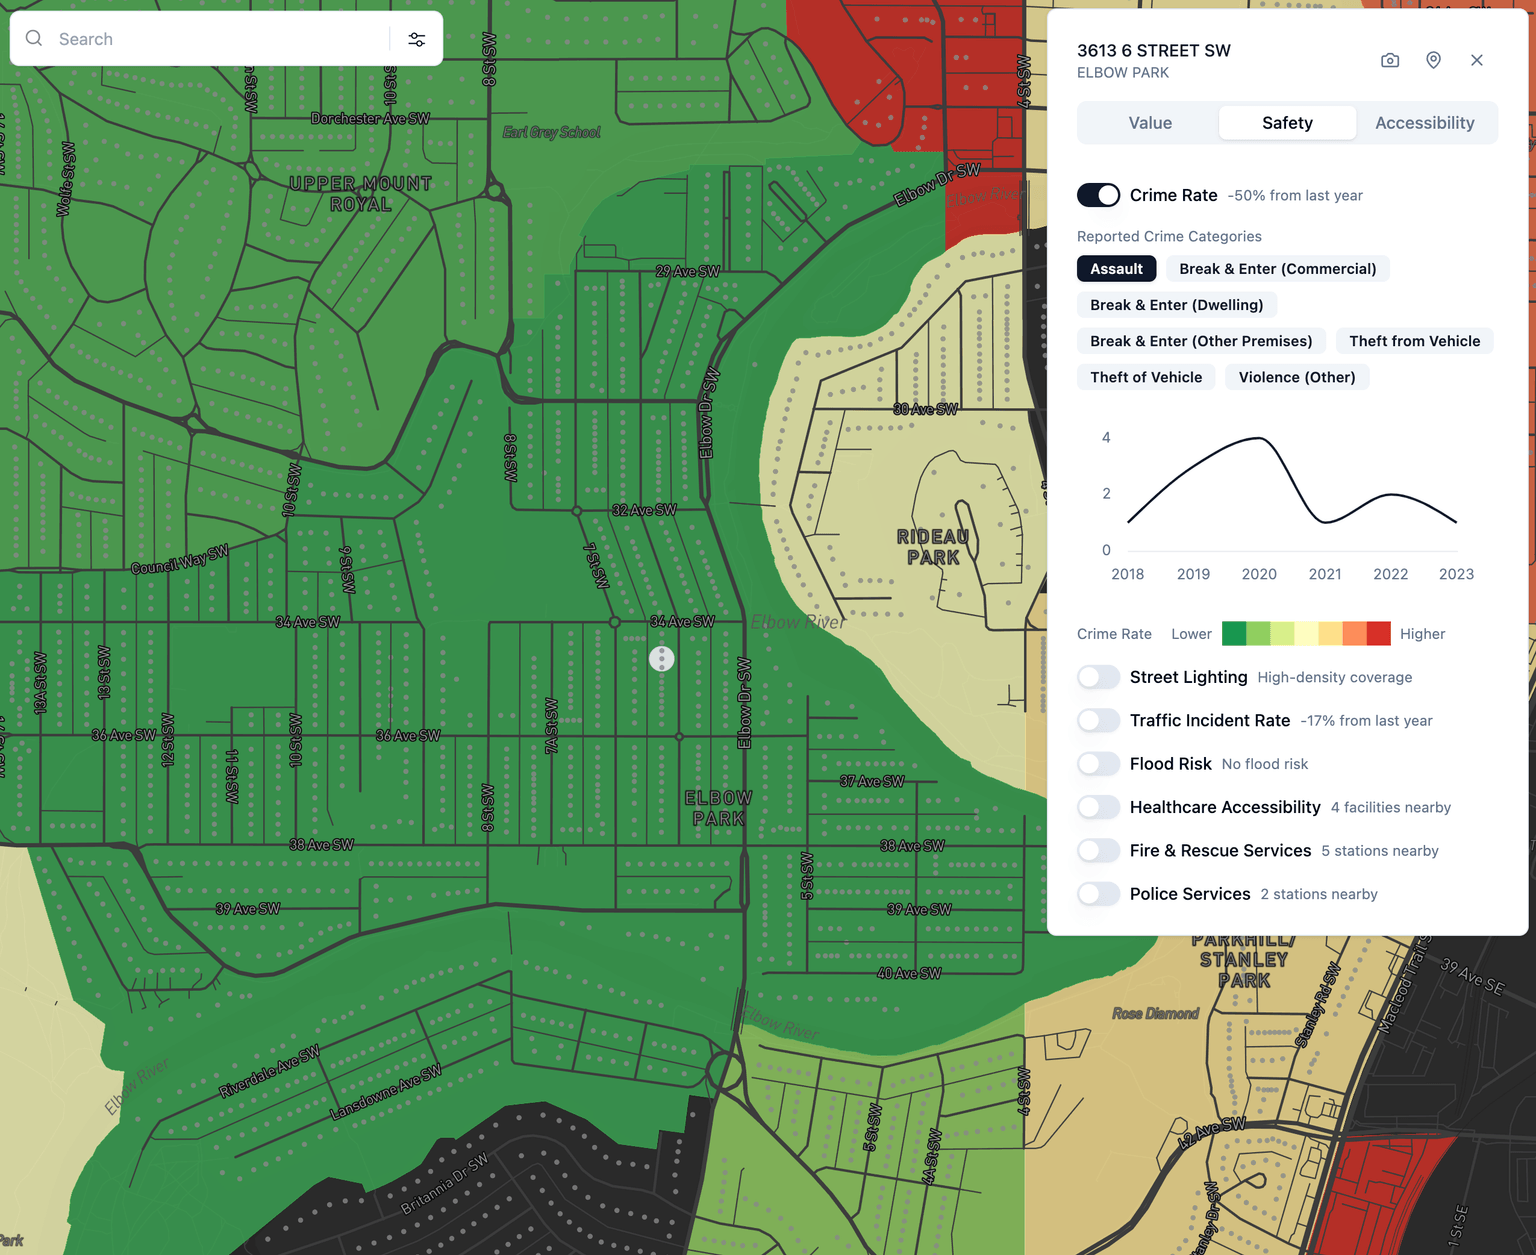
Understanding crime patterns over time is crucial for community safety assessment. Our new interactive chart breaks down historical crime rates by category, allowing you to:
- Track trends across different types of crimes
- Compare crime rates between communities
- Identify seasonal patterns and long-term trends
Street Lighting Coverage
Infrastructure plays a vital role in community safety, and proper street lighting is key. Our new street lighting feature provides:
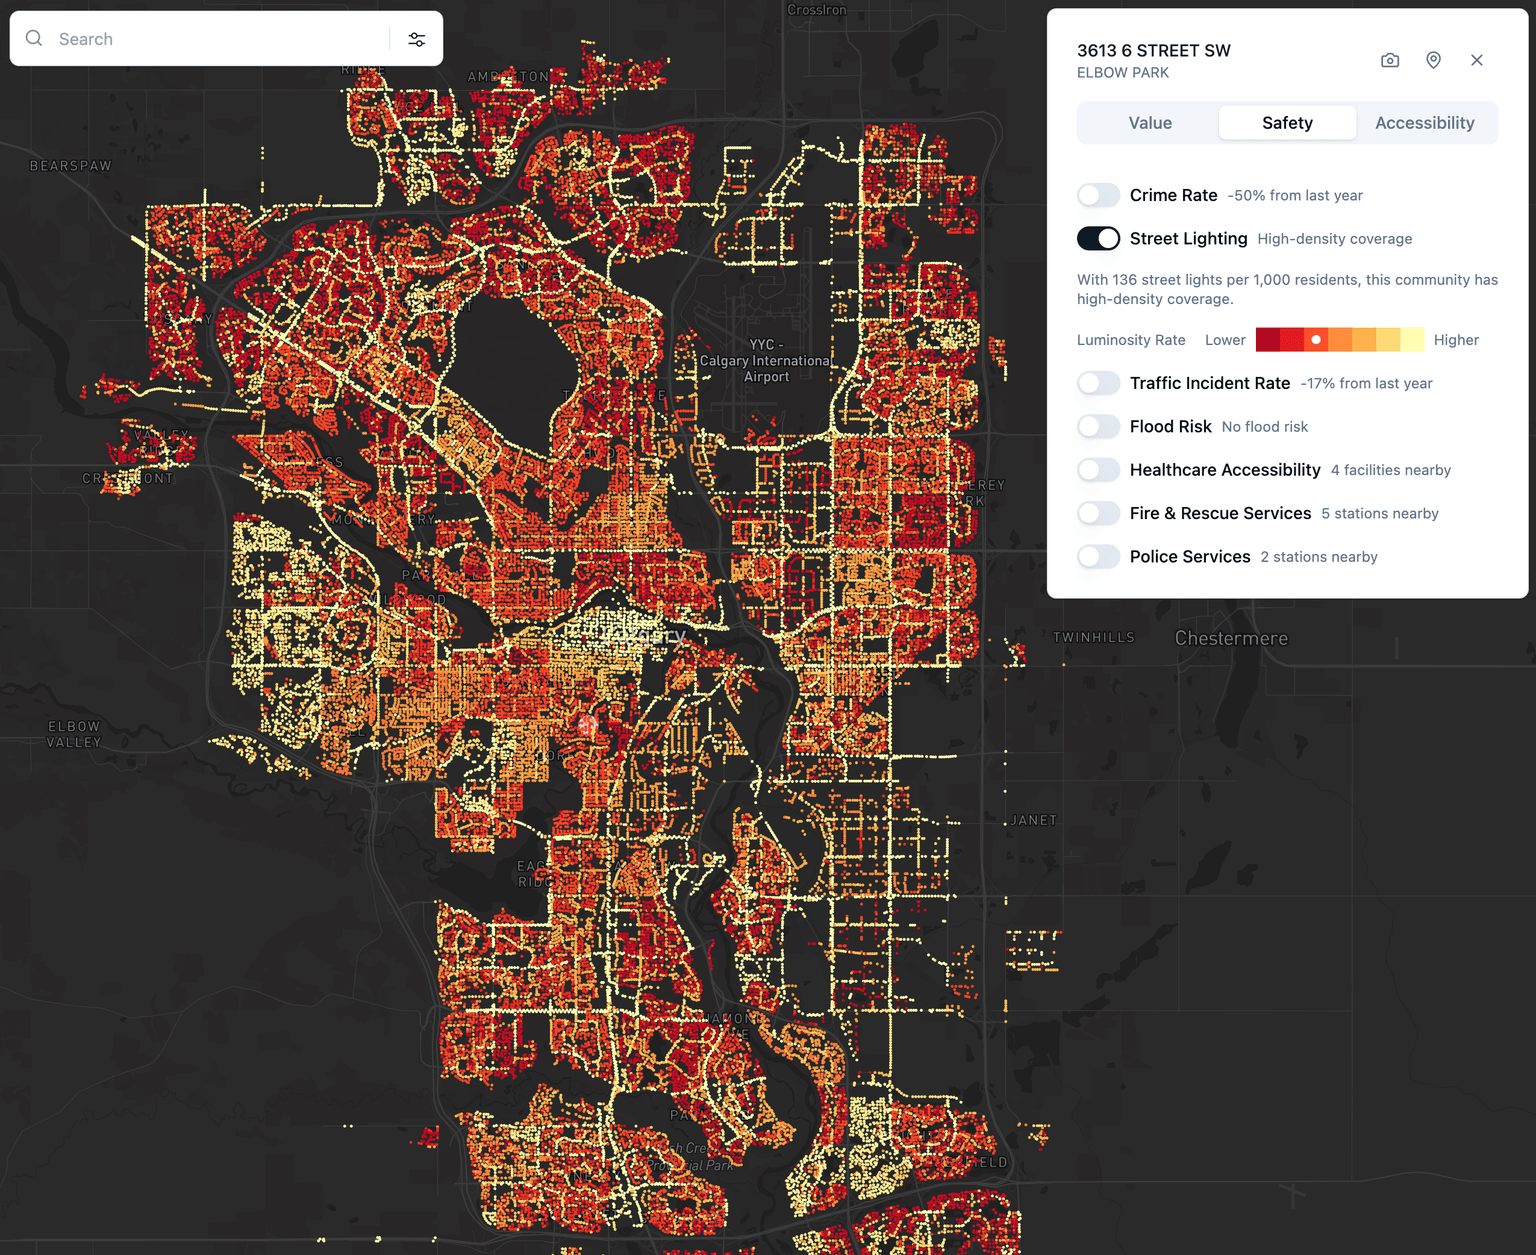
- Detailed mapping of all street lighting units across Calgary
- Coverage analysis for each community
- Luminosity indicators using an intuitive colour-coding system (red to yellow)
- Real-time insights into lighting infrastructure quality
The luminosity mapping helps you quickly identify areas with high (yellow), medium, and low (red) lighting coverage, giving you a clear picture of nighttime safety in different neighbourhoods.
Traffic Safety Analysis
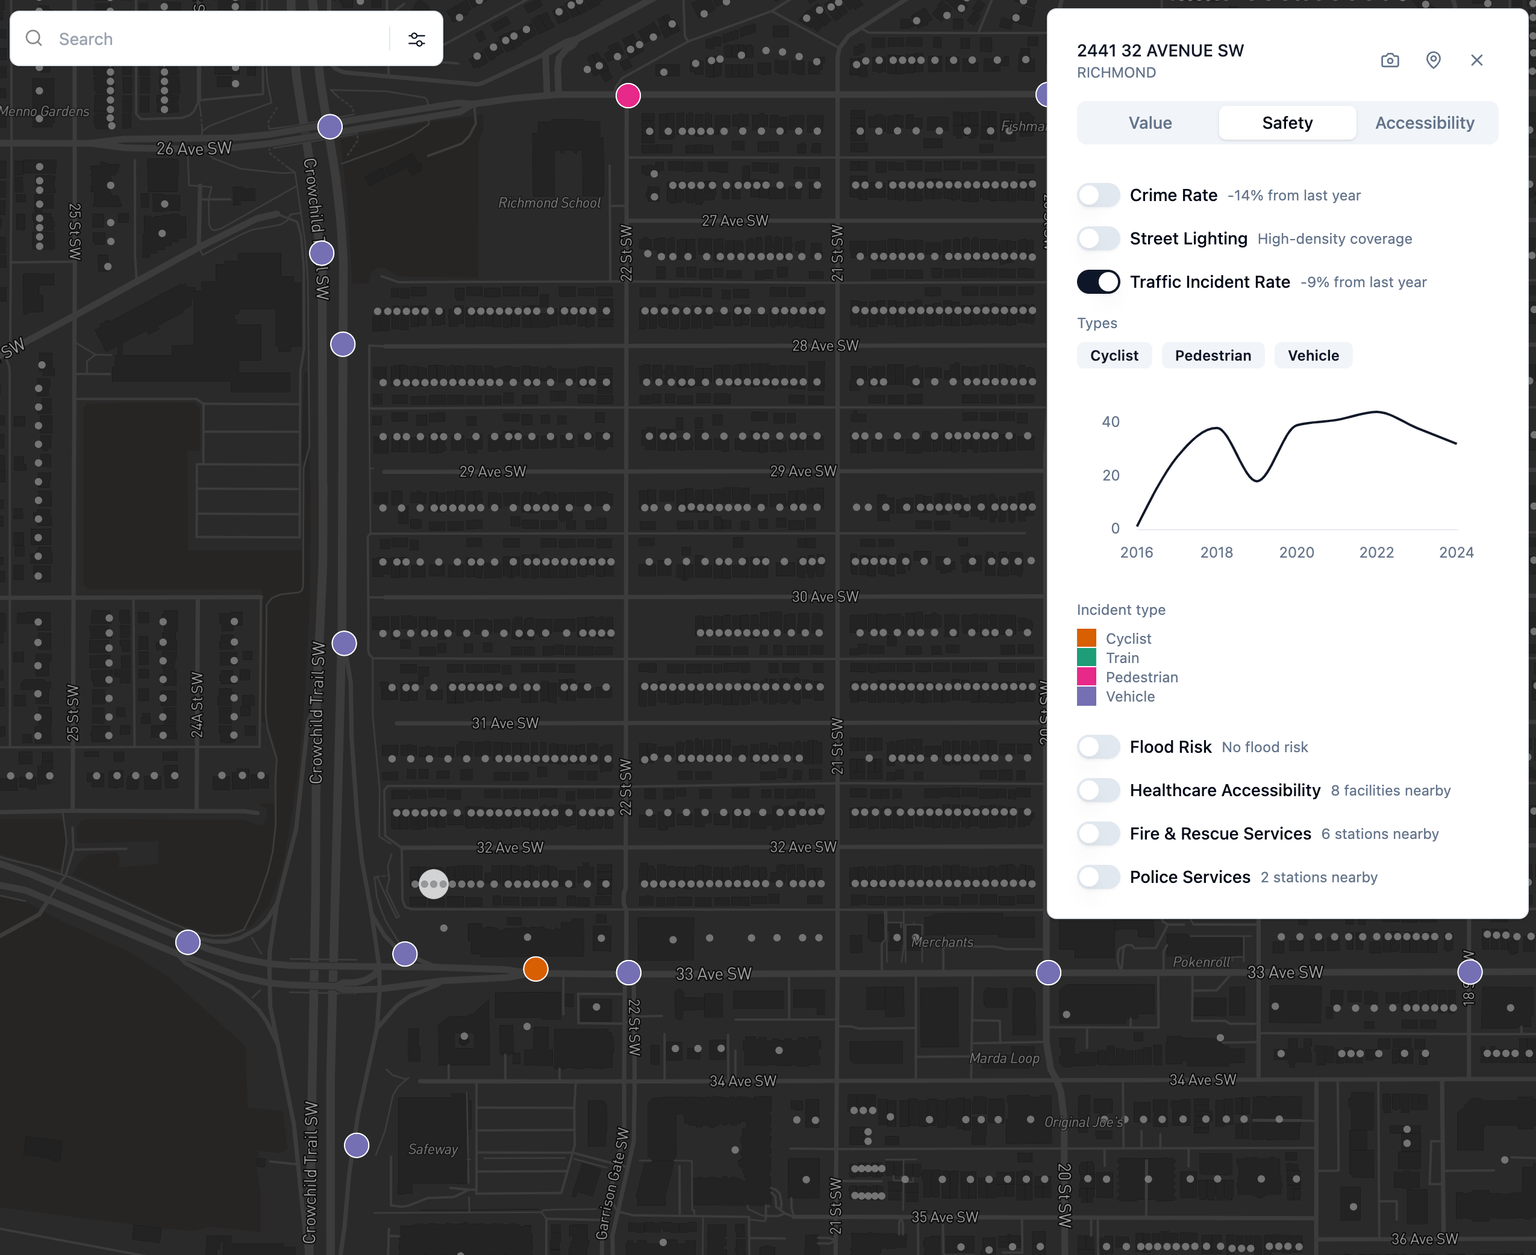
Understanding traffic safety is crucial for everyone, whether you're a driver, pedestrian, or cyclist. Our new traffic incident metric offers:
- Comprehensive incident data involving various road users:
- Pedestrians
- Cyclists
- Vehicles
- Train-related incidents
- Historical trend analysis showing safety improvements or areas of concern
- Year-over-year comparisons of incident rates
- Community-specific safety trends
Why These Updates Matter
These new features transform PickYourPlace into an even more powerful tool for making informed housing decisions. Combining crime statistics, infrastructure quality, and traffic safety data gives you a holistic view of community safety, see how these metrics come together in our analysis of Beltline's safety data. Whether you're a family looking for a safe neighbourhood, a cyclist concerned about road safety, or someone who frequently walks at night, these new metrics provide valuable insights for your decision-making process. For a look at how these data points play out across Calgary's communities, see our data-backed ranking of the safest neighbourhoods in Calgary for 2026.
What's Next
We're committed to continuing to enhance PickYourPlace with features that matter to our users. Let us know what you think and what you want to see next!
Keep reading

Who Lives in Dunbar-Southlands, Vancouver? A Census and Property-Value Read
Who lives in Dunbar-Southlands, Vancouver? We read the census profile against the 2026 assessment roll to show buyers what the numbers say.

Moving From Toronto to Calgary: Where to Live
Moving from Toronto to Calgary and unsure where to live? See how Ask turns plain-language questions into live neighbourhood data, then try it free.
Cost of Living in Calgary vs Toronto for Families: A Neighbourhood-Level Comparison
A neighbourhood-level look at cost of living for families weighing Calgary against Toronto, using census dwelling values, shelter costs, income, tenure, and walk-isochrone data.
See where the data comes from
Every source, and the four rungs between a public record and a sentence about your life, each with what it cannot tell you.
See where the data comes from