Posted on October 31, 2024
By Abraham Poorazizi
Geocoding in the Wild: Comparing Mapbox, Google, Esri, and HERE
Right after I launched PickYourPlace, I started collecting user feedback. One way I did this was by demoing the functionality to friends. A few weeks ago, after my radio interview, we had some family friends over. When my wife mentioned my project and radio appearance, they were curious to learn more. I gave them my pitch and offered to show them a demo. They eagerly agreed, so I connected my iPad to the TV and walked them through everything from the landing page to the explore page.
I was using random addresses to demonstrate different functions when I suggested trying their home address. They were excited about this idea, but things got interesting when I entered their street name. The address was "Dallyn St NW," but the search only showed "Dailyn St NW" in the suggestions. There was no "Dallyn" at all. When I checked the map, it also showed "Dailyn." Puzzled by this discrepancy, I moved on with the demo using my own address instead.
PickYourPlace uses Mapbox for maps and geocoding services, which relies on OpenStreetMap (OSM) data. When I investigated the issue on the OSM website and other OSM-based providers, I discovered they all had the incorrect spelling. While this was frustrating, finding the root cause meant I knew how to fix it.
OSM is an open location data provider—anyone can contribute data to the platform, and all that data is freely available globally. Think of it as Wikipedia for maps and location data. I've used OSM extensively over the past decade to create base maps, points of interest databases, and routing engines for various projects. While I love its open nature and excellent toolchain, this same openness led to my demo mishap. Someone had contributed incorrect data to OSM, affecting everything built on top of it.
In the geospatial world, data quality is paramount. Poor data quality—whether in completeness or freshness—impacts everything: base maps show wrong information, geocoders return incorrect addresses and coordinates, and routing engines produce faulty results. No matter how great the software is, bad data leads to poor outcomes.
Fortunately, contributing to OSM is straightforward. You can create an account on openstreetmap.org and start editing the world map immediately. Unlike other providers like Google, Esri, or HERE—where change requests can take months if they're even possible—OSM changes can go live in minutes to days. After I fixed the street names and residential property addresses, Mapbox incorporated my updates within a week. That's faster than most companies' typical two-week sprint cycle for releases. The images below show the before and after states of the corrected street name.
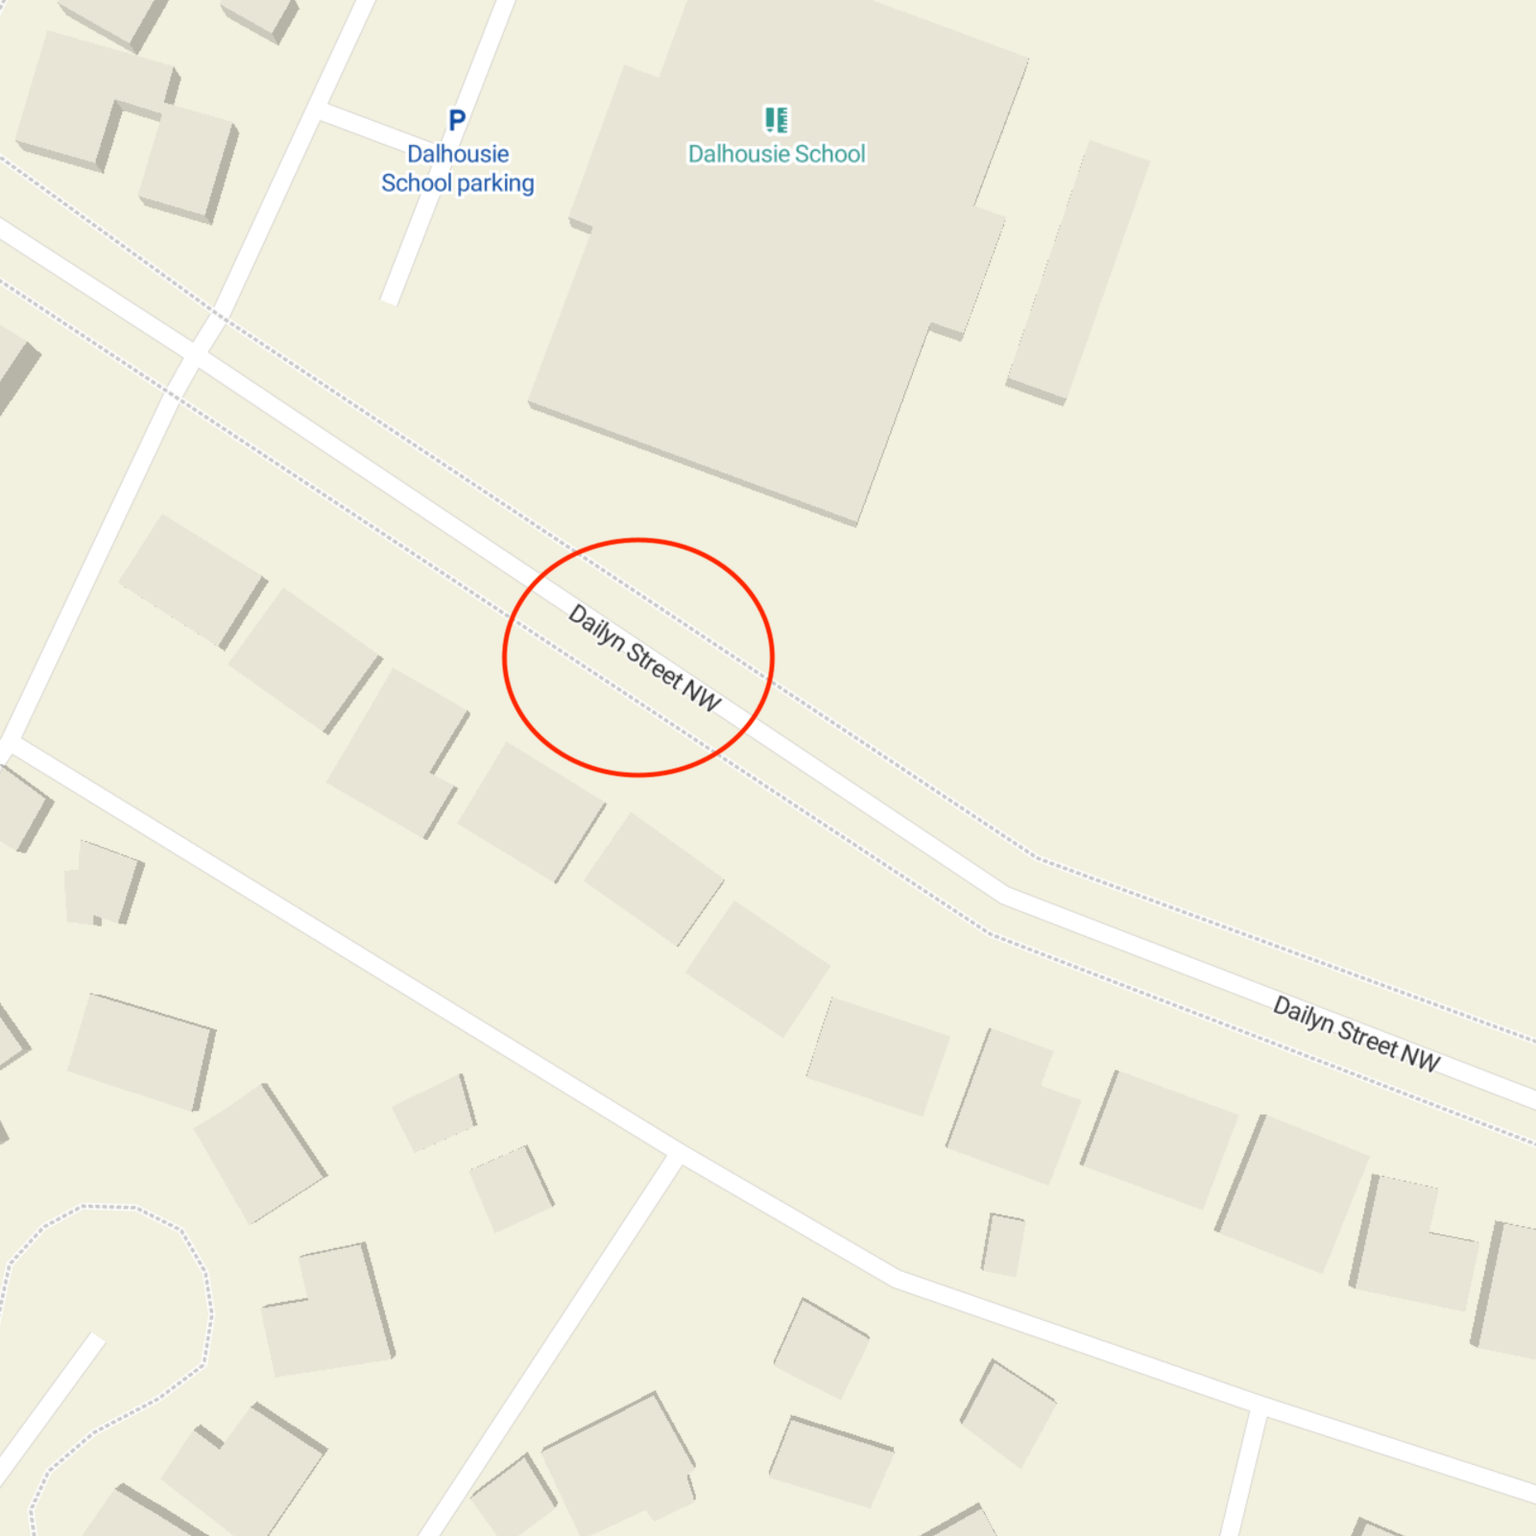
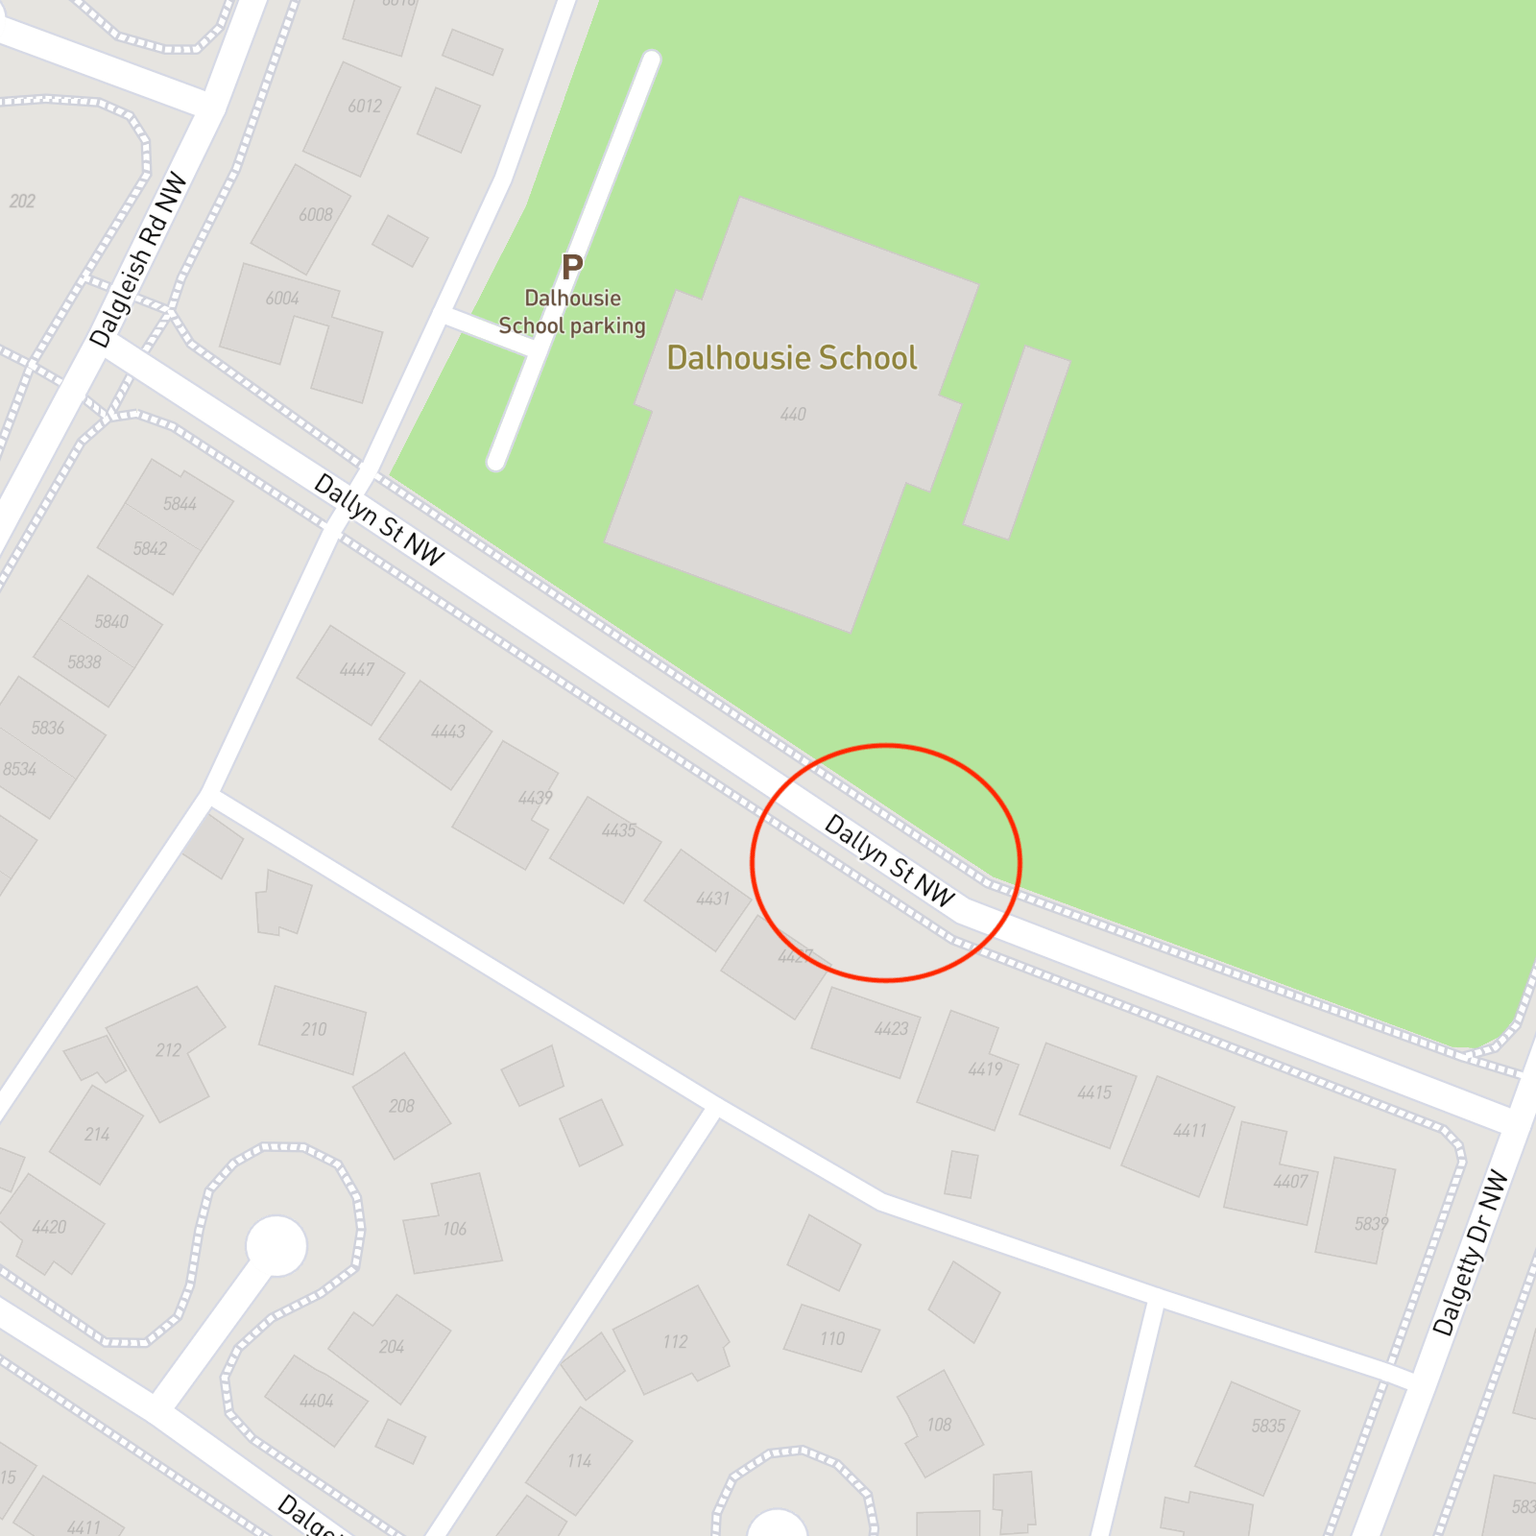
This experience highlighted the importance of data quality in location-based products. Bad data makes any product less usable or unusable entirely. It also prompted me to examine geocoding more closely. Those familiar with geospatial technology understand the process of choosing a service provider. Geocoding providers typically fall into two categories: those using OSM or other open data, like Mapbox, Stadia Maps, and OpenCage, and proprietary solutions like Google, Esri, and HERE. The ongoing debate about which provider to choose often comes down to several factors, with data quality at the forefront.
Should I switch providers? To answer this objectively, I decided to conduct an experiment. Last year, while working on the Amazon Location Service team at AWS, I performed a similar analysis comparing Esri and HERE geocoders. This time, I wanted to evaluate how Mapbox performs against Esri, HERE, and Google.
What is Geocoding?
Geocoding converts addresses into geographic coordinates, enabling us to place locations on a map. The process involves three main steps:
- Parsing input data
- Querying the reference database
- Assigning geographic coordinates
The primary outputs are geographic coordinates (longitude and latitude pairs). The process also produces normalized address components like street number, street name, city, postal code, region, and country, which help with consistent formatting and data enrichment.
Different providers may produce varying results based on how they collect and maintain their data. They might combine proprietary sources, open data, and AI-assisted mapping, updating their databases on different schedules. All these factors affect output quality.
Evaluation Framework
Let's examine the key metrics for comparing geocoders:
Match Rate
The percentage of successfully geocoded addresses relative to total submitted addresses. A higher match rate indicates better address resolution.
Accuracy
Compares geocoding results to baseline data in two ways:
- Positional accuracy: How close each geocoded point is to the "true" location (baseline/ground truth), measured by spatial distance
- Lexical accuracy: How closely returned address labels match the "true" address labels, measured using Levenshtein distance (minimum single-character edits needed to transform one string into another)
Similarity
Performs pairwise comparisons between geocoders:
- Positional similarity: How similar geocoded points are spatially
- Lexical similarity: How similar address formats and spellings are
Your use case determines which metrics matter most. If you only need geographic coordinates, focus on match rate and positional metrics, ignoring lexical ones.
Test Scenarios
I tested the geocoders using three scenarios with 1,000 randomly selected Canadian addresses from the City of Calgary's open data portal:
Scenario 1: Basic Input
Used raw input data with just address fields (no city, province, postal code, or country). Example:
id,address,latitude,longitude
85,25 EVERGREEN CR SW,50.9215815275547,-114.100897916366
Scenario 2: Enriched Input
Added city, province, and country to addresses. Example:
25 EVERGREEN CR SW, Calgary, AB, Canada
Scenario 3: Misspelled Input
Modified Scenario 2 addresses by removing "E" and "W" from quadrant indicators. Example:
25 EVERGREEN CR S, Calgary, AB, Canada
Methods
I used Python 3.9 in a Jupyter Notebook environment and:
- Downloaded residential address and city boundary datasets
- Obtained API keys from:
- Amazon Location Service (for Esri and HERE)
- Google Maps Platform
- Mapbox
- Canada Post (for address verification)
For each scenario, I:
- Geocoded addresses using all providers
- Collected Canada Post-verified addresses as baseline
- Analyzed results for match rate, accuracy, and similarity
Results and Analysis
Match Rate
In Scenario 1, HERE and Mapbox geocoders demonstrated superior performance with match rates exceeding 99%, with over 75% of geocoded addresses falling within city boundaries. Esri showed the weakest performance, achieving only a 60% match rate, with just 3% of geocoded addresses within city limits. This indicates that HERE, Mapbox, and Google handle incomplete addresses more effectively than Esri.
For Scenarios 2 and 3, all providers showed marked improvement. Esri, Google, and Mapbox performed similarly, achieving the highest match rates and slightly outperforming HERE by approximately 3%.
| Geocoder | Scenario | Match Rate (%) | Within City Boundary (%) |
|---|---|---|---|
| Esri | 1 | 60.8 | 3.3 |
| HERE | 1 | 99.2 | 84.1 |
| 1 | 83.6 | 76.8 | |
| Mapbox | 1 | 100 | 76.9 |
| Esri | 2 | 100 | 100 |
| HERE | 2 | 97.5 | 97.4 |
| 2 | 99.9 | 99.9 | |
| Mapbox | 2 | 100 | 100 |
| Esri | 3 | 100 | 99.9 |
| HERE | 3 | 96.7 | 96.4 |
| 3 | 100 | 99.7 | |
| Mapbox | 3 | 100 | 100 |
Positional Accuracy
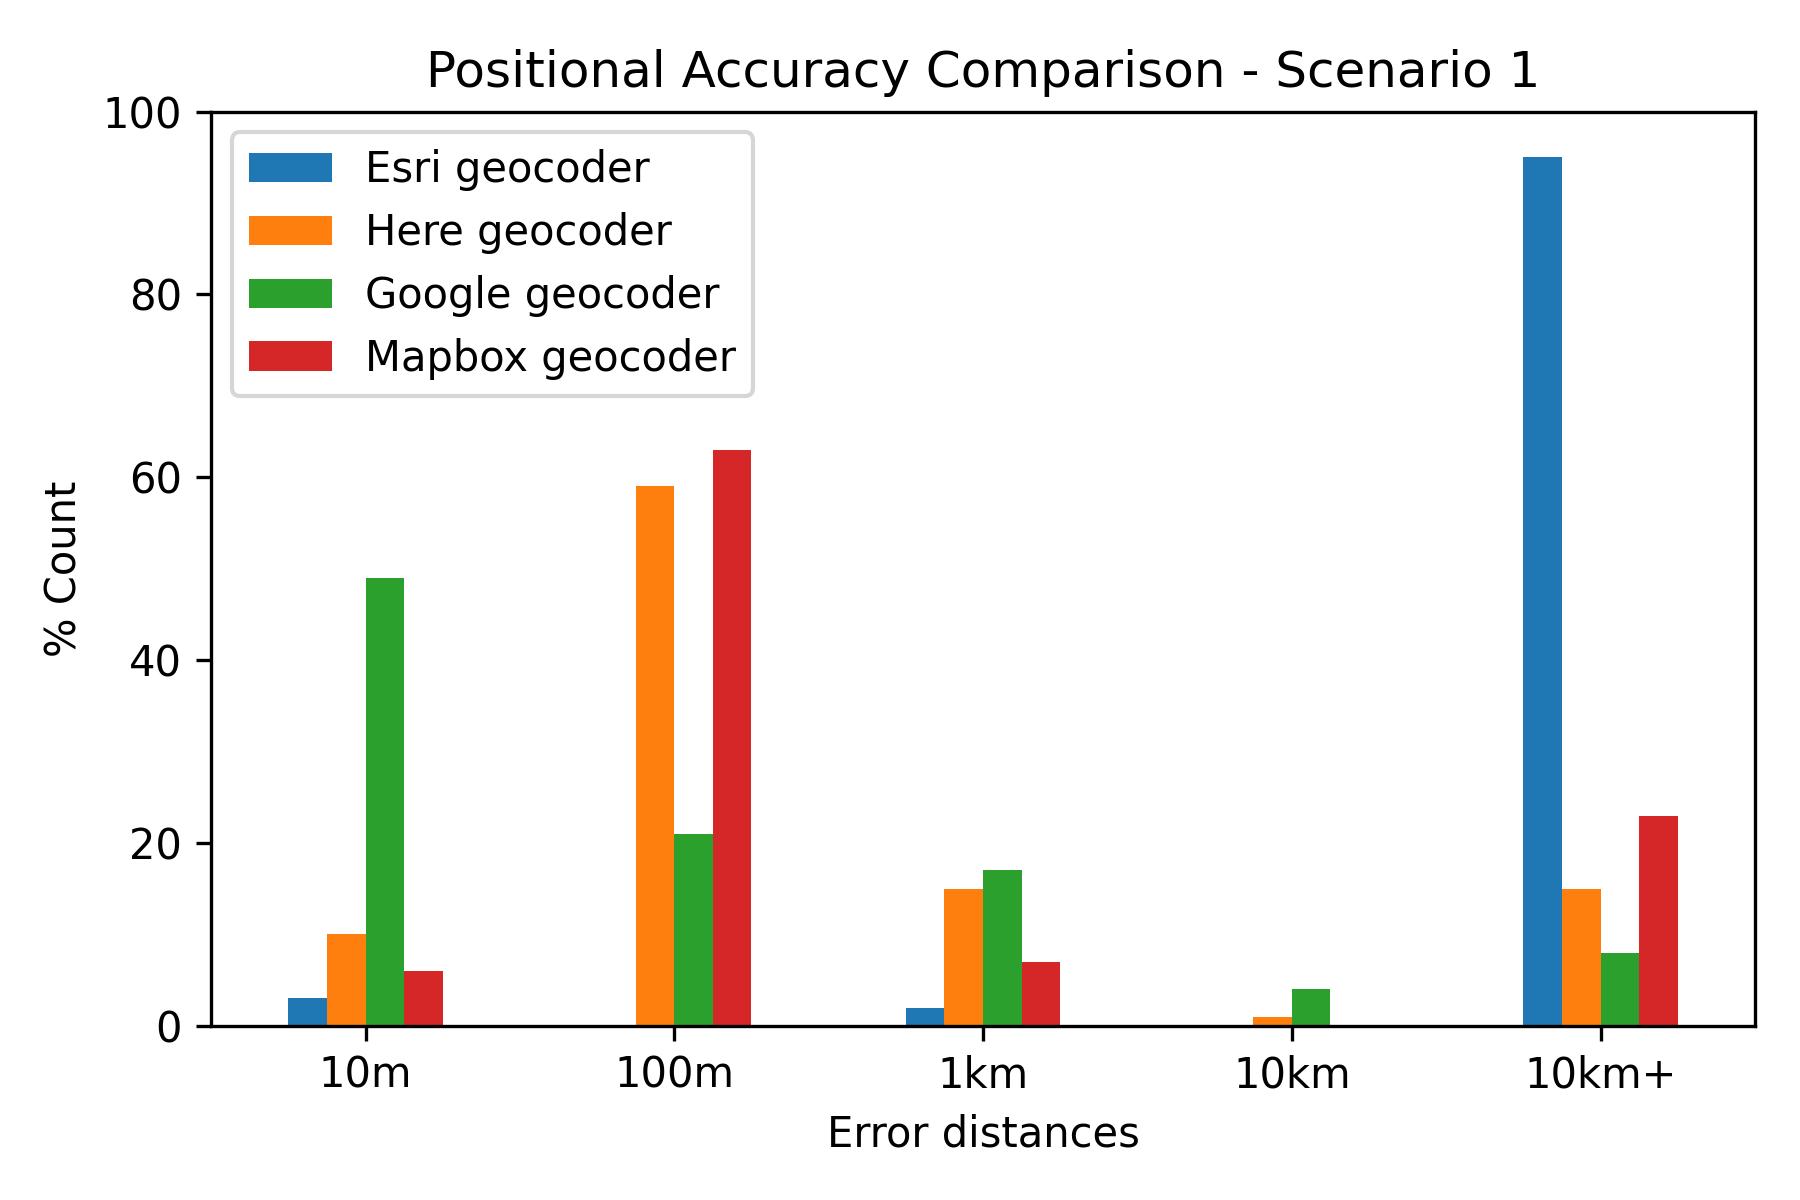
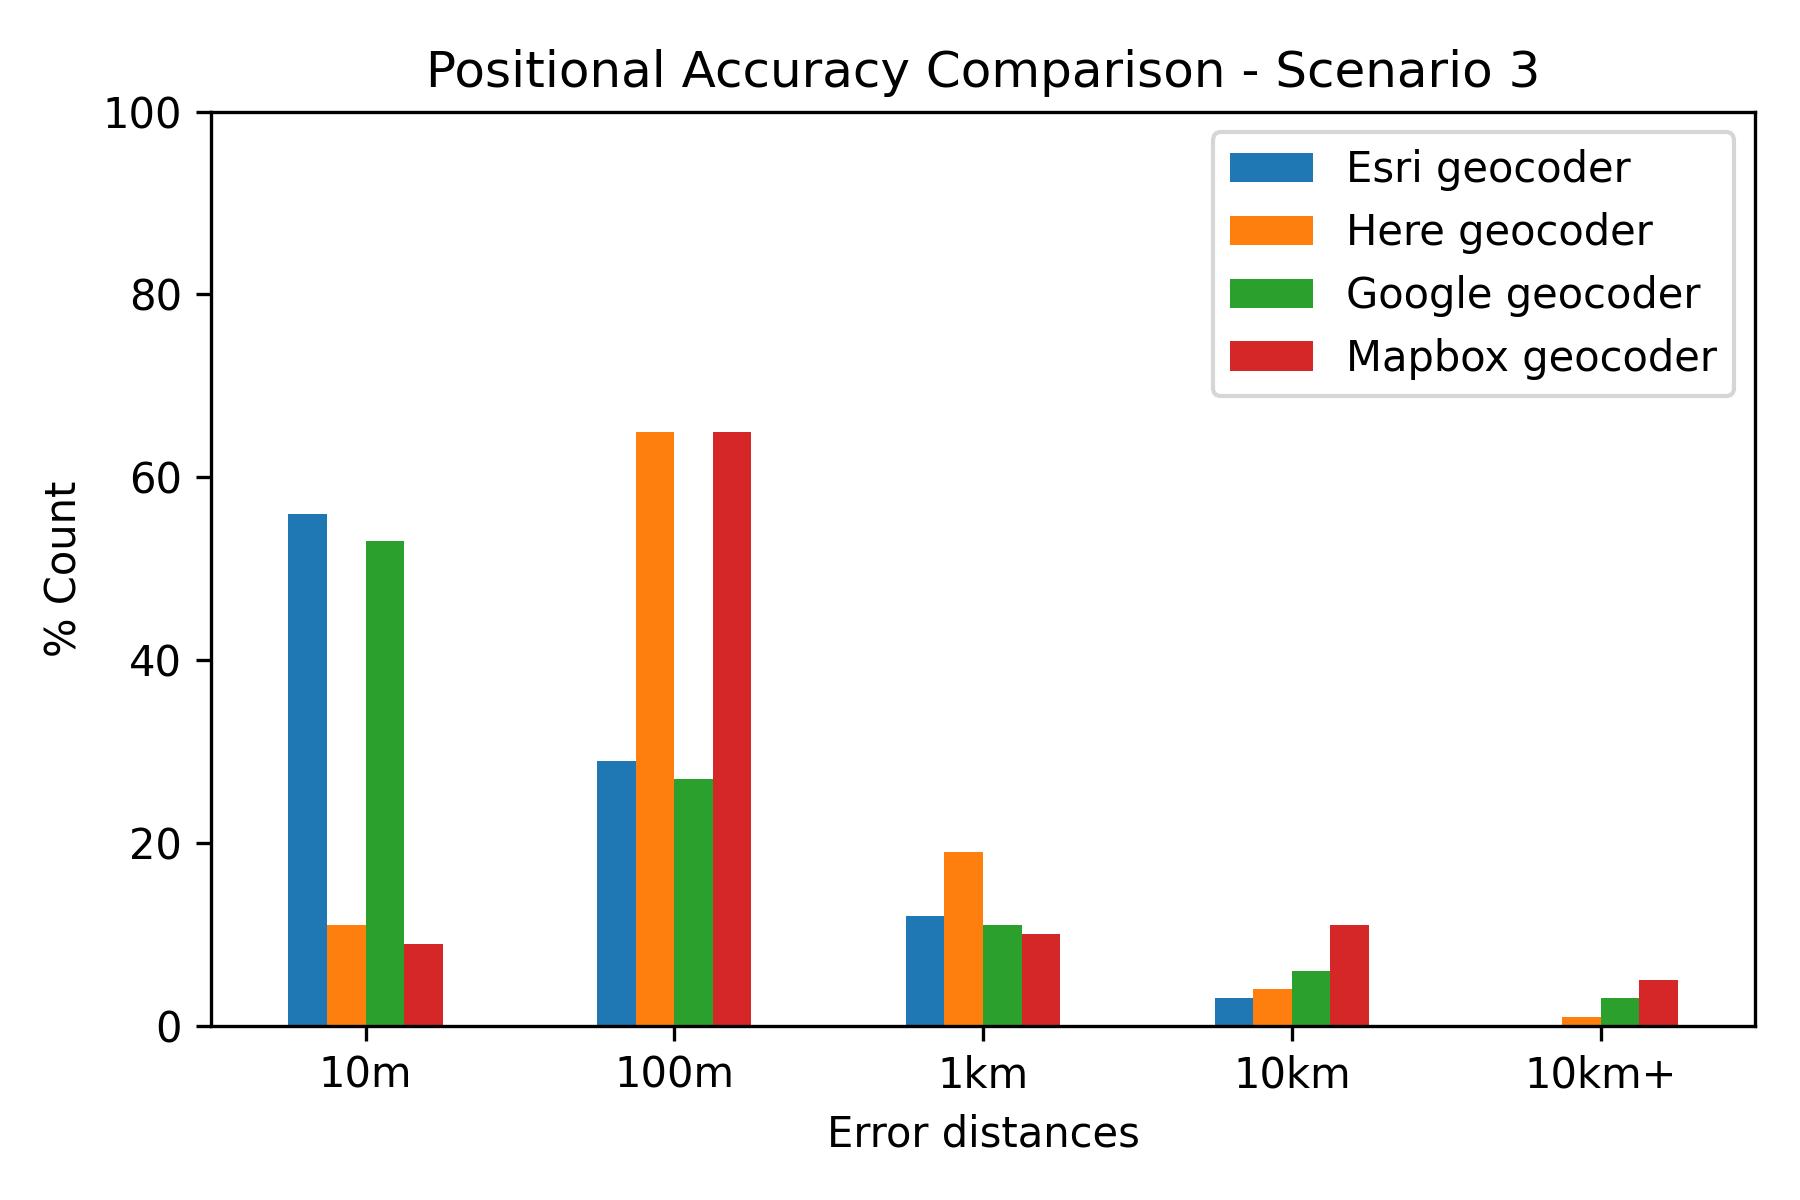
In Scenario 1, Google emerged as the leader with a median error distance of 10.8m, with 49% of its geocoded points falling within 10m of the baseline. HERE and Mapbox showed similar performance, with approximately 60% of their geocoded points within 100m of the baseline. Esri's results largely deviated by more than 10km from the baseline.
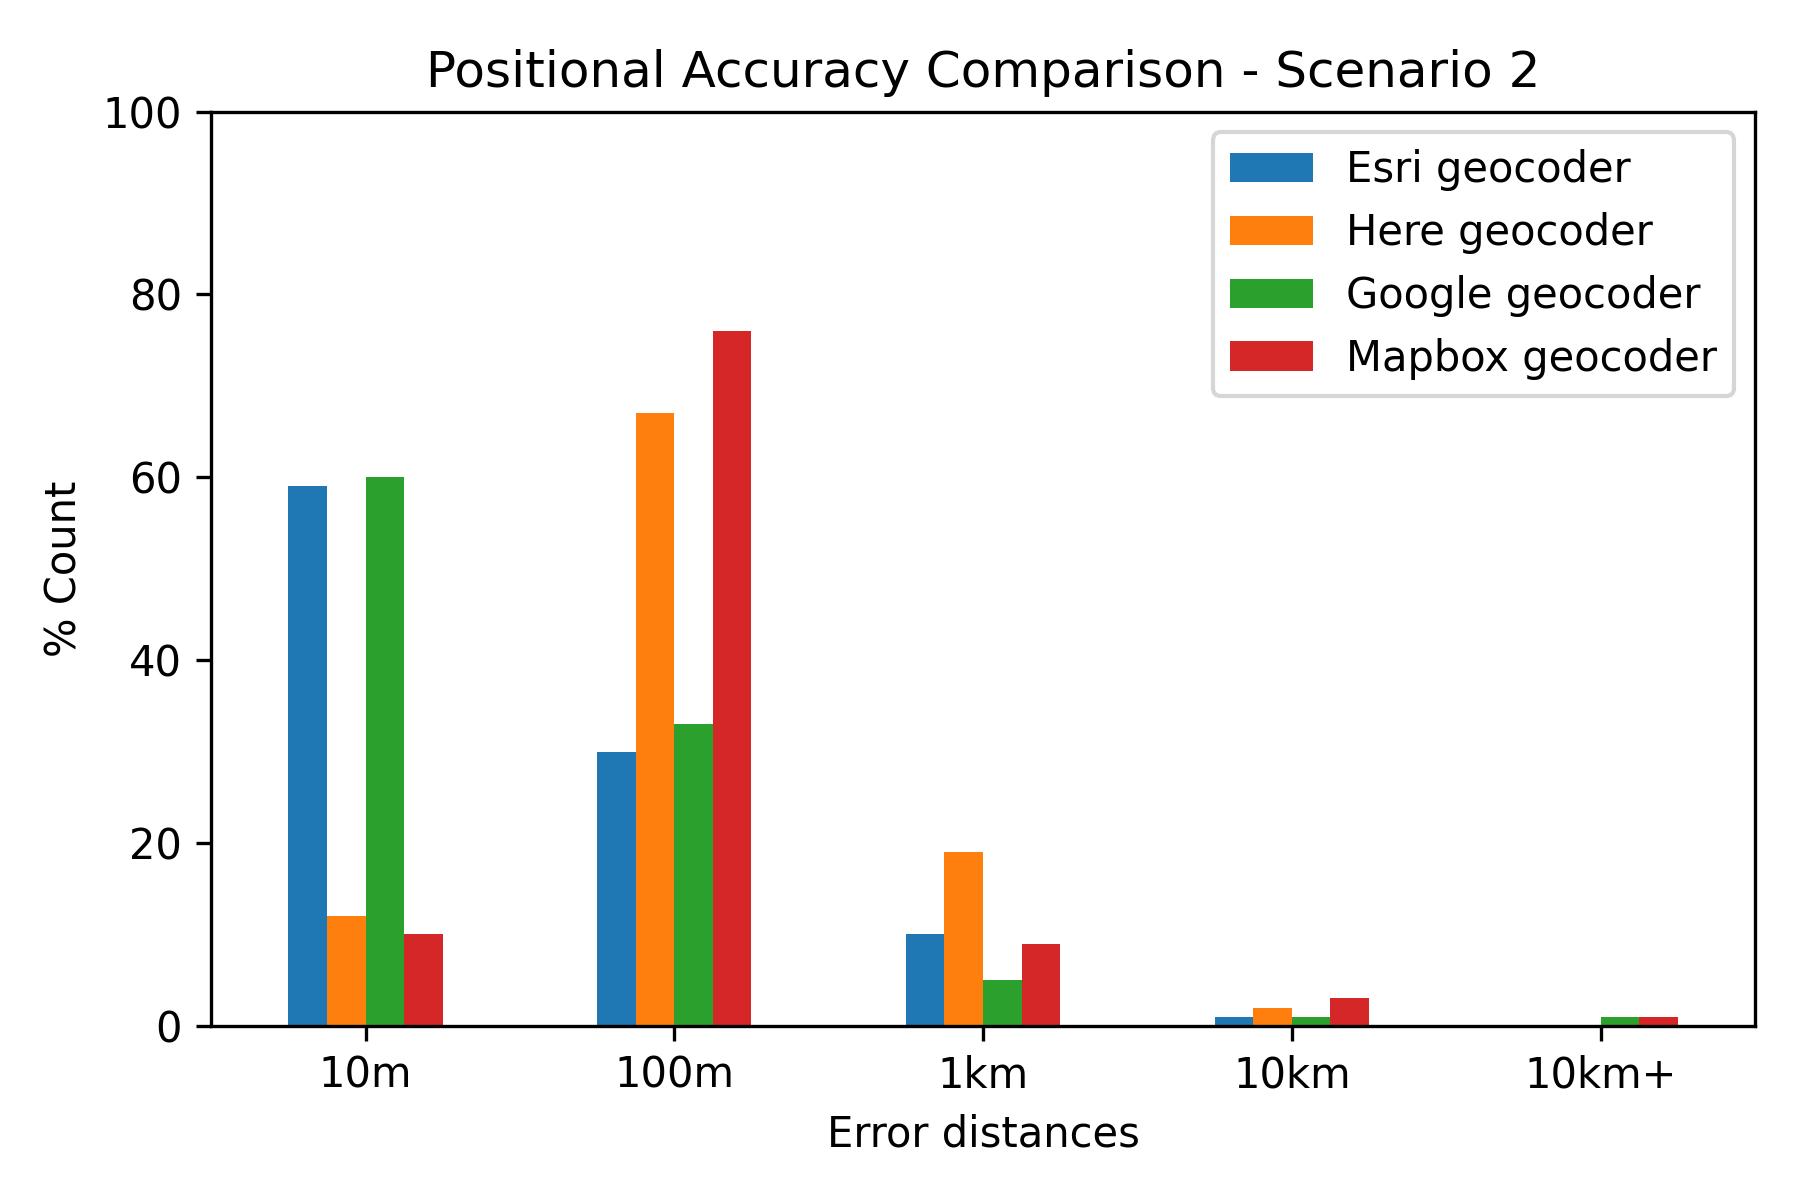
All providers showed significant improvement in the next two scnearios. Esri and Google performed similarly, achieving the best results with median error distances of 6m and 7m in Scenario 2, and 7m and 8m in Scenario 3, respectively. About 60% of their geocoded points fell within 10m of the baseline.
Detailed statistics showed that approximately 60% of points from Esri and Google were within 10m of the baseline, while about 70% from HERE and Mapbox were within 100m.
| Geocoder | Scenario | Min | Max | Mean | Std Dev | Median |
|---|---|---|---|---|---|---|
| Esri | 1 | 0.53 | 22,575,100 | 7,976,350 | 6,880,390 | 6,156,970 |
| HERE | 1 | 0.47 | 22,517,100 | 516,878 | 1,772,340 | 18.49 |
| 1 | 0.41 | 8,924,780 | 210,405 | 948,787 | 10.79 | |
| Mapbox | 1 | 0.01 | 27,670,700 | 1,257,570 | 3,379,560 | 16.69 |
| Esri | 2 | 0.001 | 1,519.57 | 58.26 | 168.38 | 6.40 |
| HERE | 2 | 0.47 | 45,141 | 248.63 | 1,726.07 | 16.79 |
| 2 | 0.45 | 18,856.7 | 219.40 | 1,585.15 | 7.08 | |
| Mapbox | 2 | 0.01 | 18,773.4 | 325.09 | 1,629.47 | 15.60 |
| Esri | 3 | 0.001 | 180,513 | 351.37 | 5,791.30 | 7.01 |
| HERE | 3 | 0.47 | 52,277.3 | 511.25 | 3,015.81 | 17.01 |
| 3 | 0.45 | 3,378,970 | 4,192.05 | 106,880 | 8.72 | |
| Mapbox | 3 | 0.01 | 15,146 | 1,333.55 | 3,268.78 | 16.54 |
Positional Similarity
HERE and Mapbox demonstrated the highest degree of similarity across all scenarios, with nearly half their geocoded points within 10m of each other. Their similarity was strongest in Scenario 2, showing a median pairwise distance of 8m.
| Comparison | Scenario | Min | Max | Mean | Std Dev | Median |
|---|---|---|---|---|---|---|
| Esri-Mapbox | 1 | 0.001 | 29,005,200 | 8,213,320 | 7,310,320 | 6,584,510 |
| HERE-Mapbox | 1 | 0.000 | 28,626,200 | 1,527,360 | 3,479,520 | 59.23 |
| Google-Mapbox | 1 | 0.000 | 27,670,700 | 1,455,490 | 3,441,950 | 38.41 |
| Esri-Mapbox | 2 | 0.000 | 18,772.9 | 351.68 | 1,629.17 | 11.97 |
| HERE-Mapbox | 2 | 0.000 | 45,146.1 | 486.25 | 2,277.60 | 8.08 |
| Google-Mapbox | 2 | 0.000 | 18,856.1 | 520.77 | 2,247.75 | 13.57 |
| Esri-Mapbox | 3 | 0.000 | 173,912 | 1,555.01 | 6,373.30 | 13.51 |
| HERE-Mapbox | 3 | 0.000 | 51,241.7 | 1,559.14 | 4,136.16 | 15.19 |
| Google-Mapbox | 3 | 0.000 | 3,378,950 | 5,359.96 | 106,883 | 19.56 |
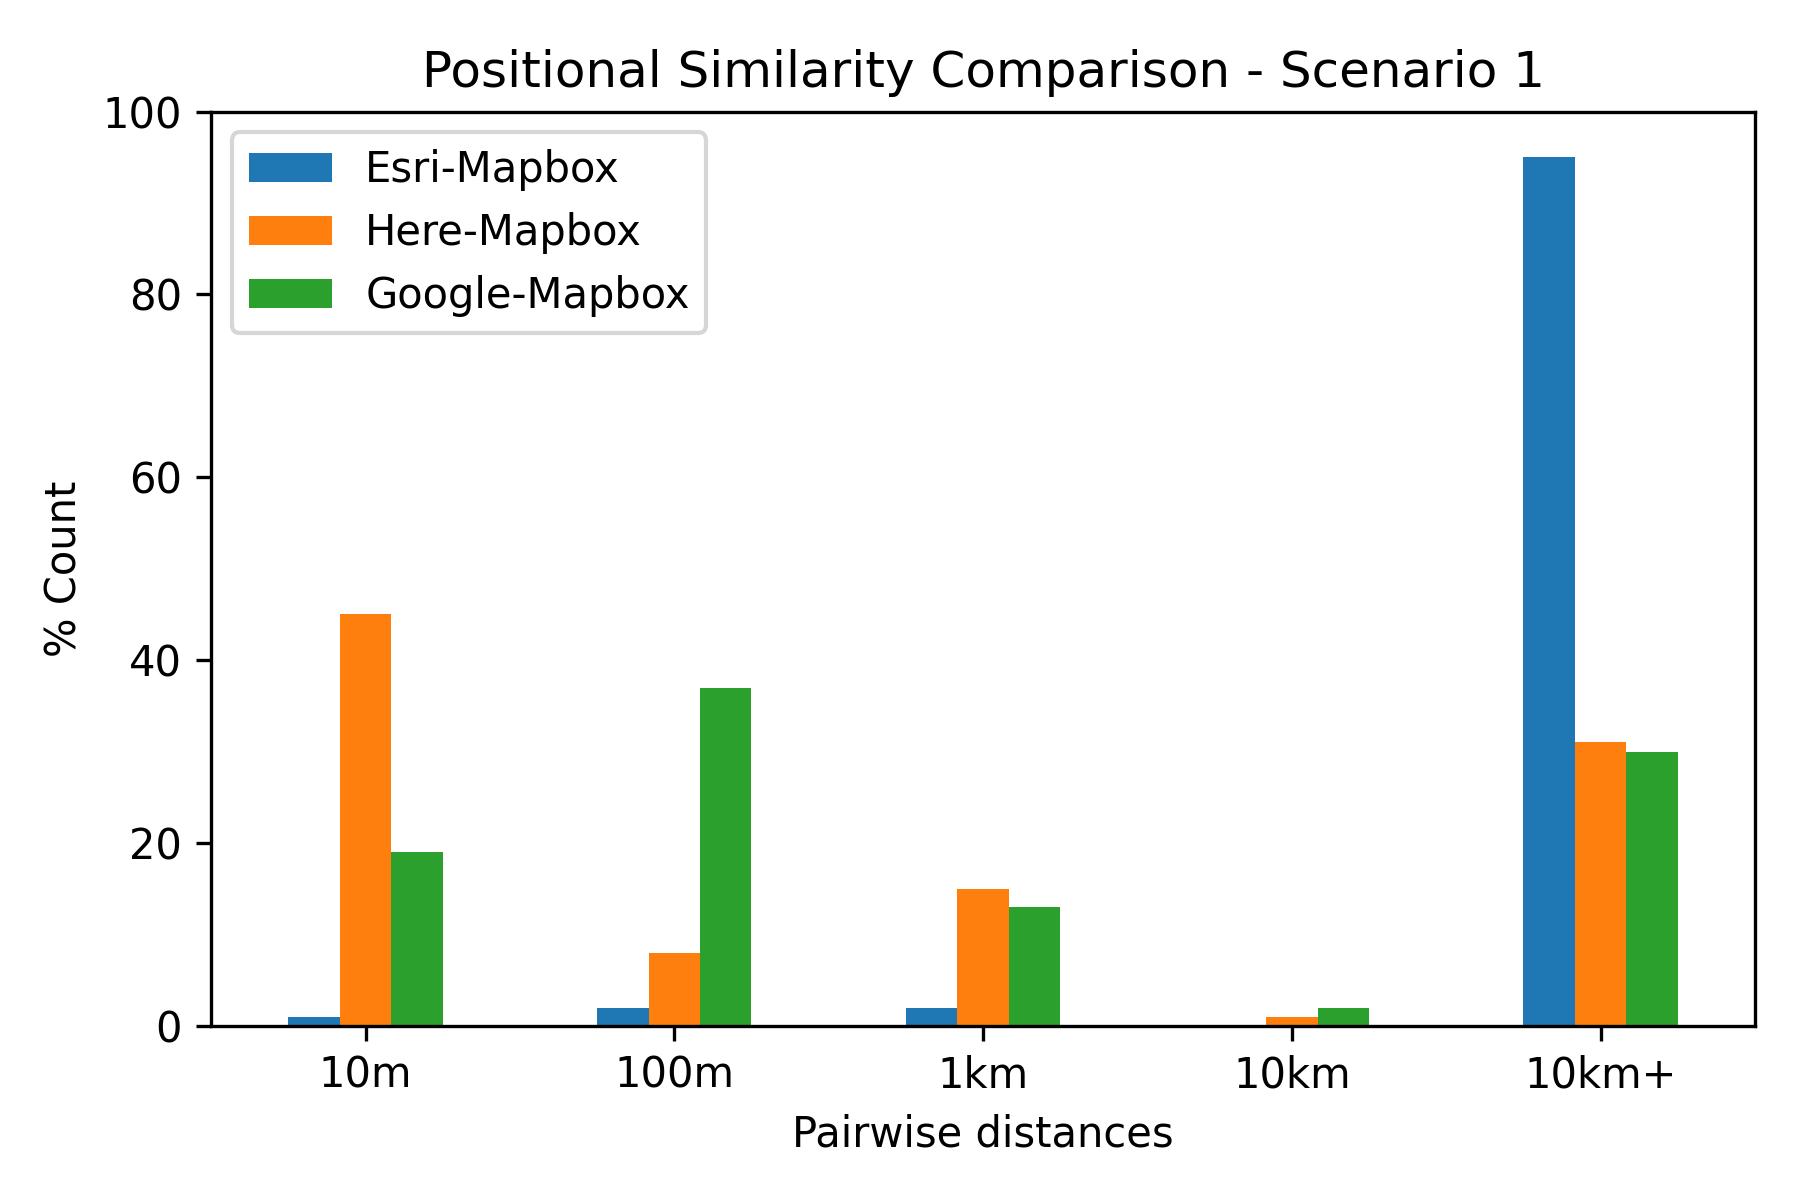
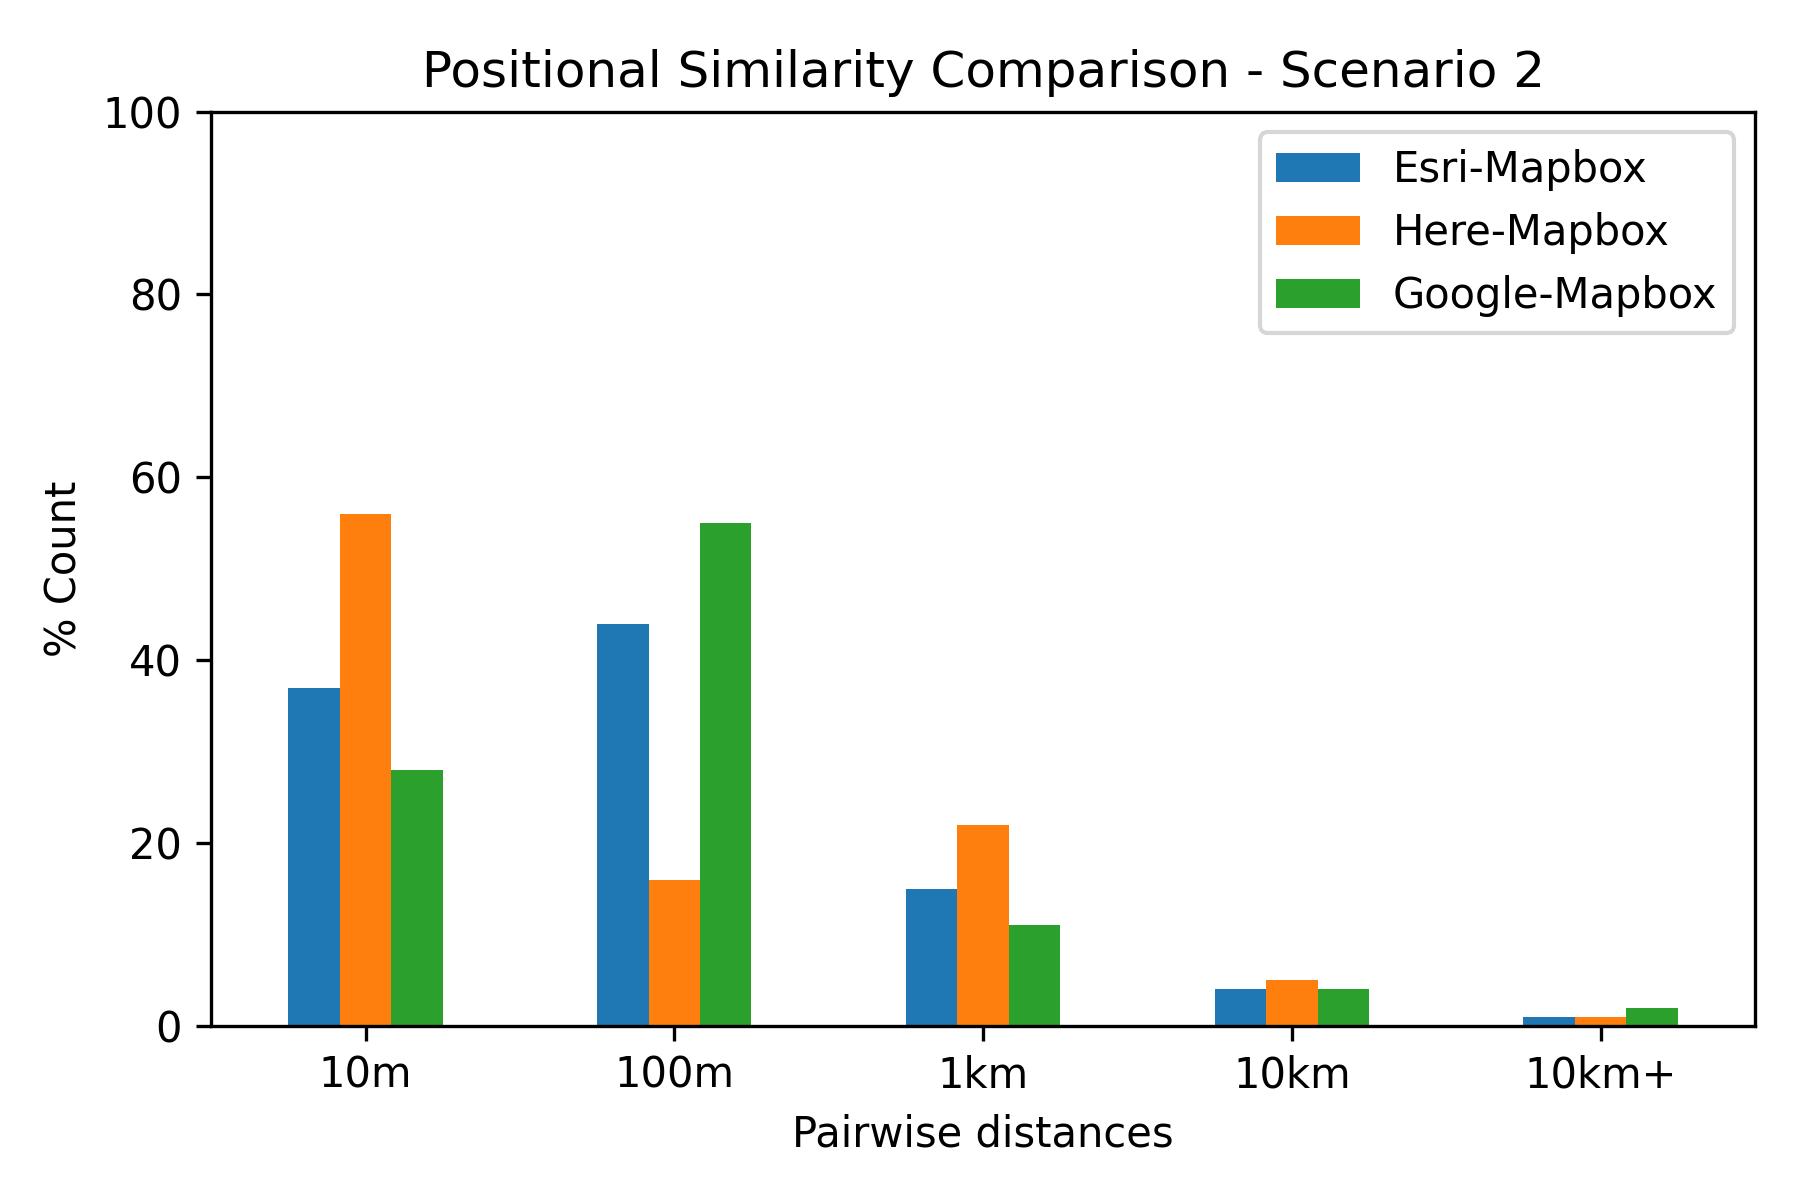
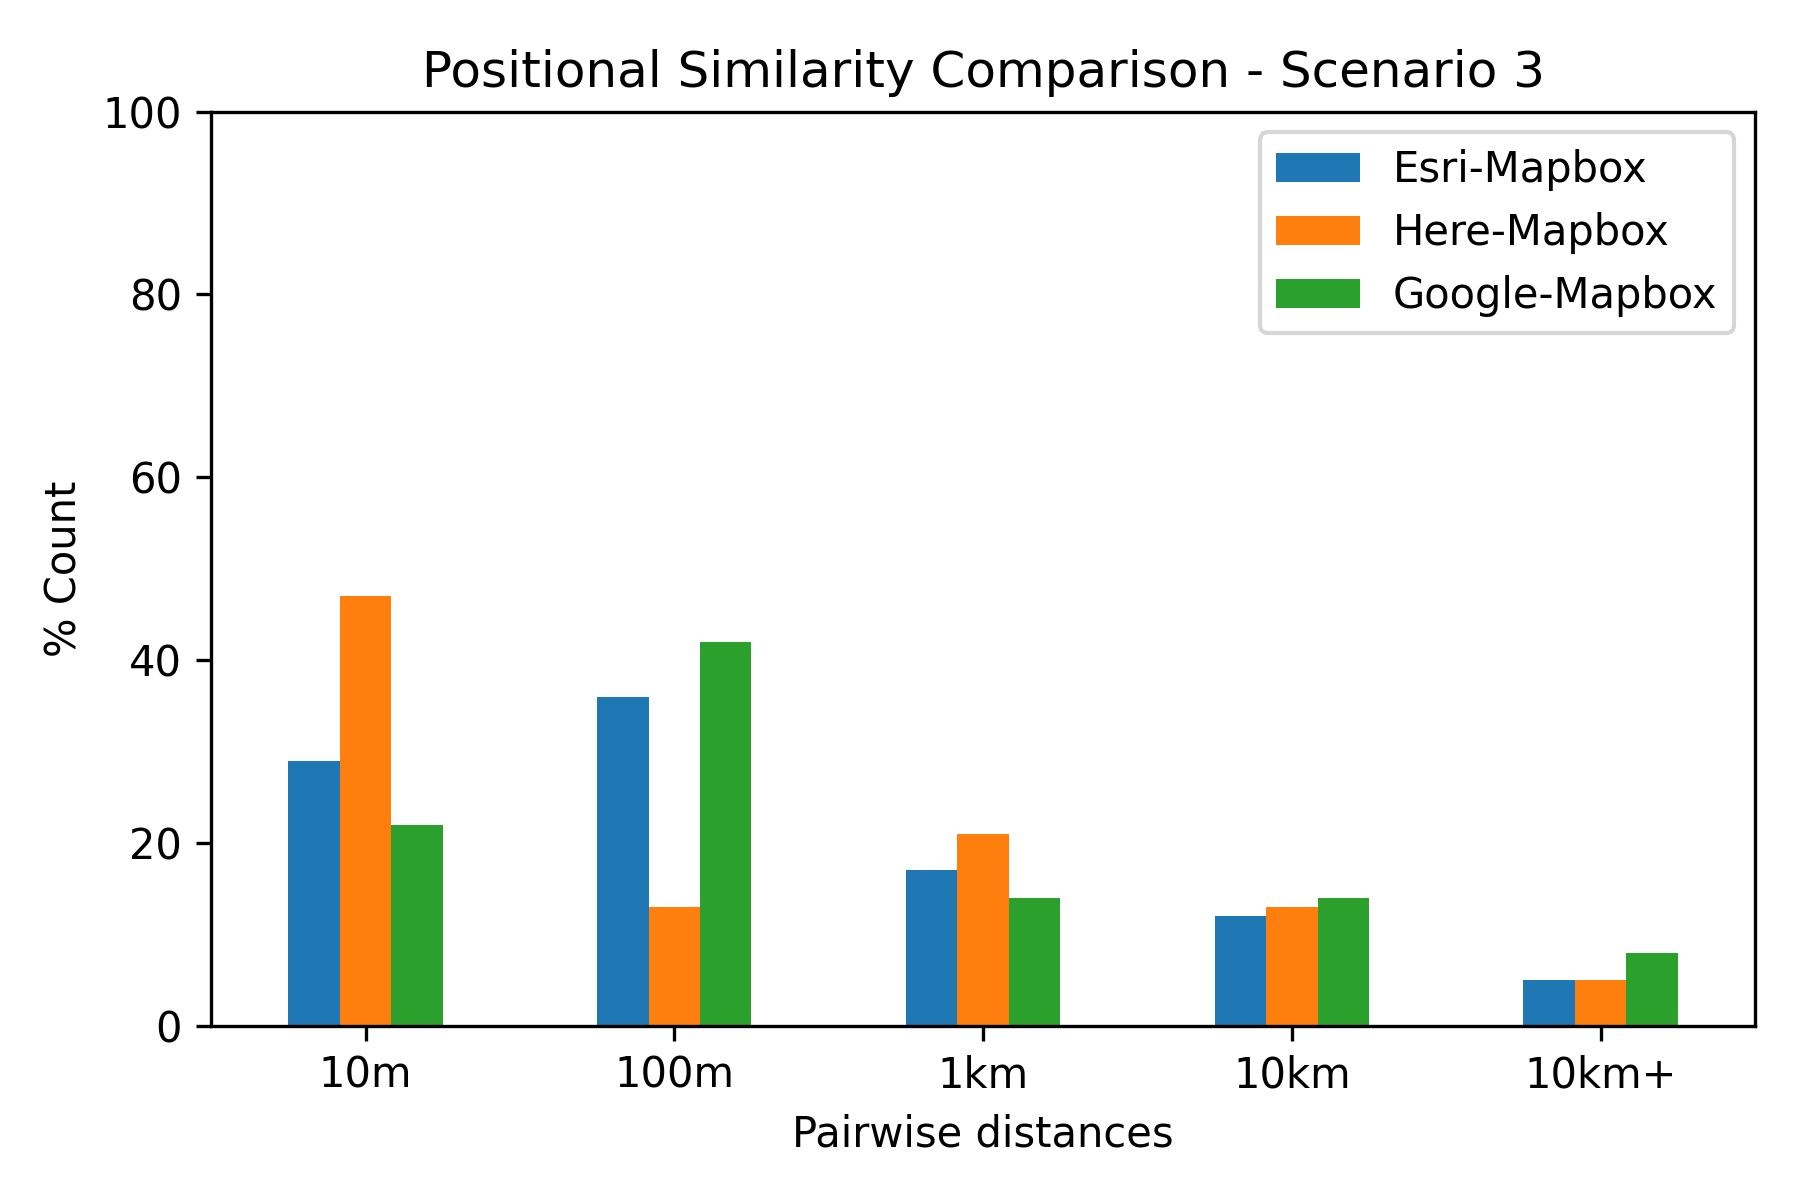
The similarity analysis revealed:
- Strong correlation between HERE and Mapbox results
- Consistent performance across different input formats
- Greater divergence in results when handling incomplete addresses
Lexical Accuracy
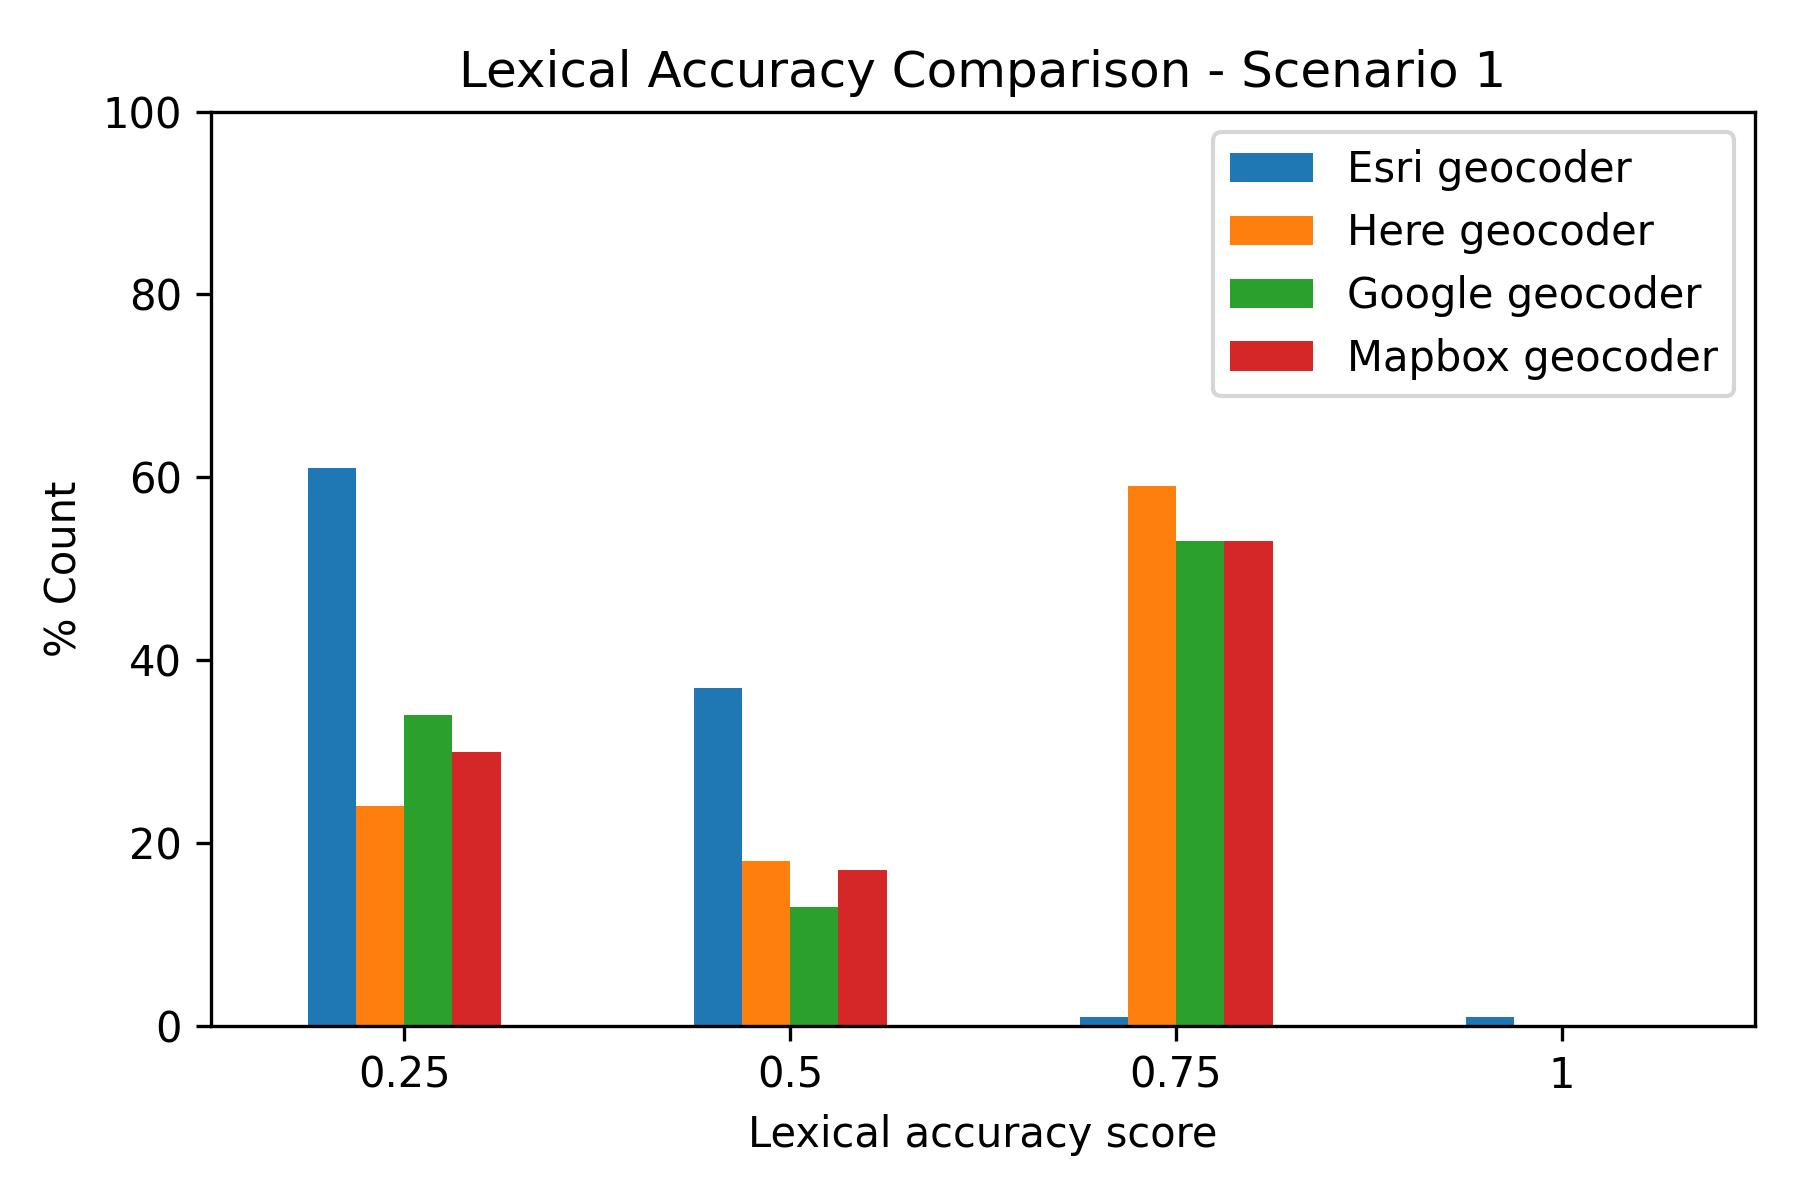
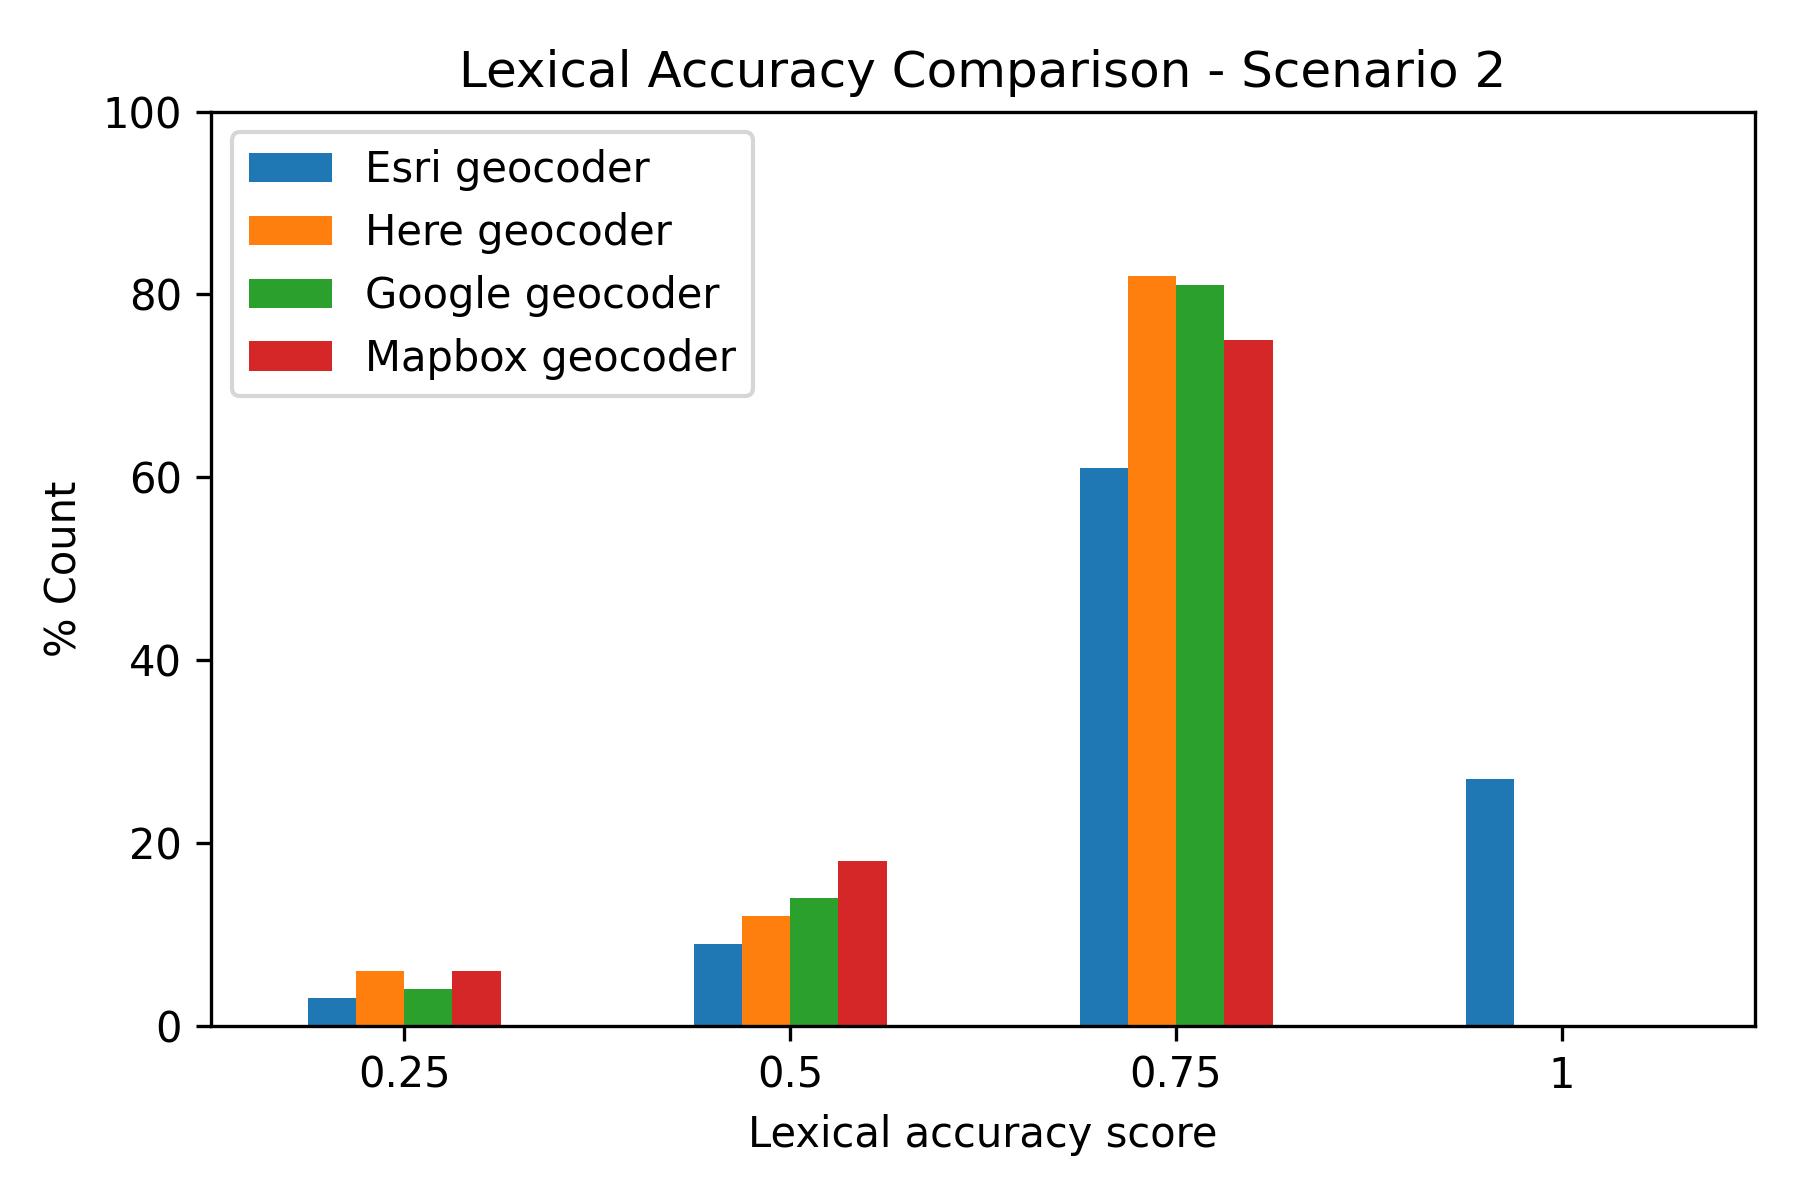
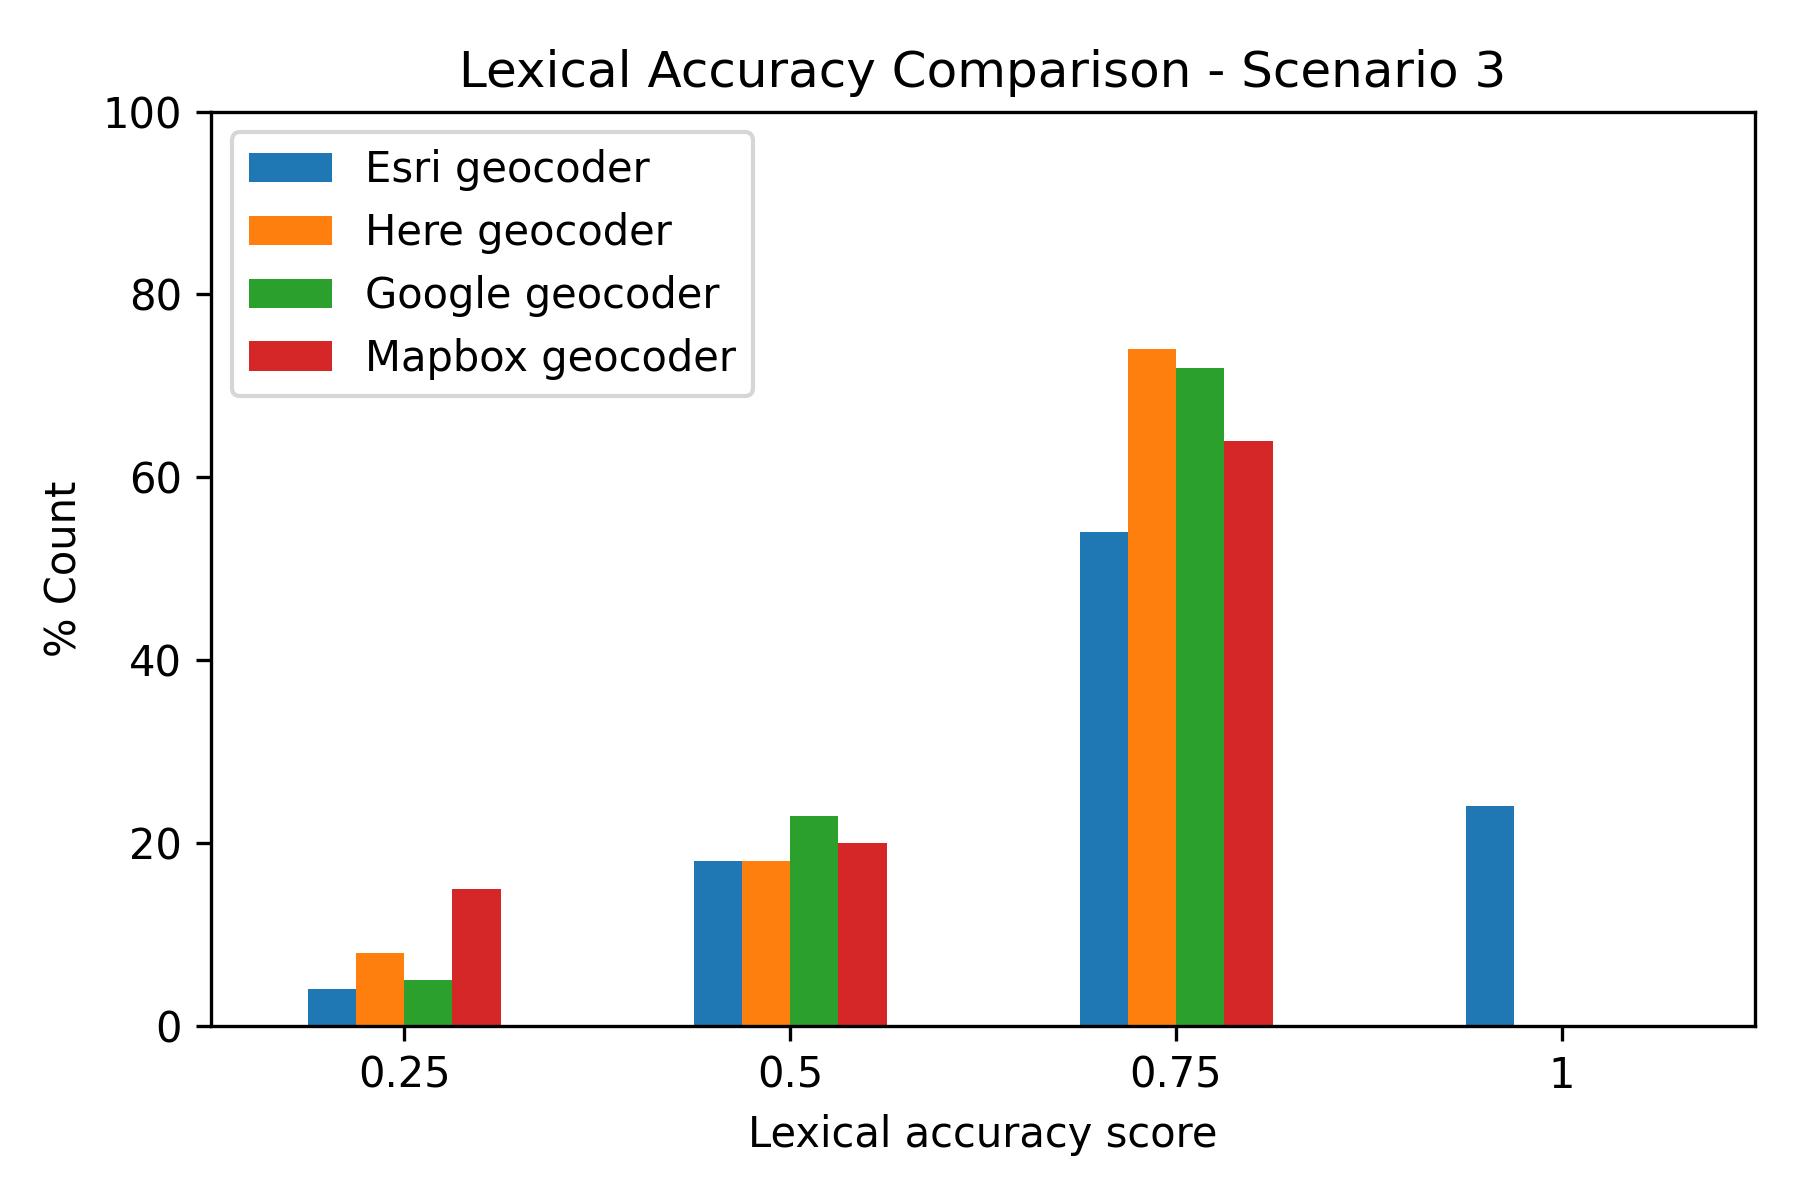
In Scenario 1, HERE, Google, and Mapbox performed similarly, with median similarity scores between 0.5 and 0.6. For Scenarios 2 and 3, Esri stood out with over 20% of results achieving the highest lexical accuracy score. The other providers maintained consistent performance, with approximately 80% of their results achieving a 0.75 lexical accuracy score.
| Geocoder | Scenario | Min | Max | Mean | Std Dev | Median |
|---|---|---|---|---|---|---|
| Esri | 1 | 0.000 | 0.793 | 0.169 | 0.195 | 0.000 |
| HERE | 1 | 0.000 | 0.734 | 0.451 | 0.272 | 0.602 |
| 1 | 0.000 | 0.734 | 0.391 | 0.292 | 0.530 | |
| Mapbox | 1 | 0.000 | 0.684 | 0.389 | 0.245 | 0.526 |
| Esri | 2 | 0.000 | 0.793 | 0.649 | 0.156 | 0.709 |
| HERE | 2 | 0.000 | 0.734 | 0.580 | 0.172 | 0.642 |
| 2 | 0.000 | 0.734 | 0.583 | 0.153 | 0.633 | |
| Mapbox | 2 | 0.000 | 0.690 | 0.527 | 0.147 | 0.580 |
| Esri | 3 | 0.000 | 0.793 | 0.617 | 0.180 | 0.667 |
| HERE | 3 | 0.000 | 0.734 | 0.551 | 0.196 | 0.635 |
| 3 | 0.000 | 0.743 | 0.552 | 0.173 | 0.615 | |
| Mapbox | 3 | 0.000 | 0.690 | 0.484 | 0.178 | 0.571 |
Lexical Similarity
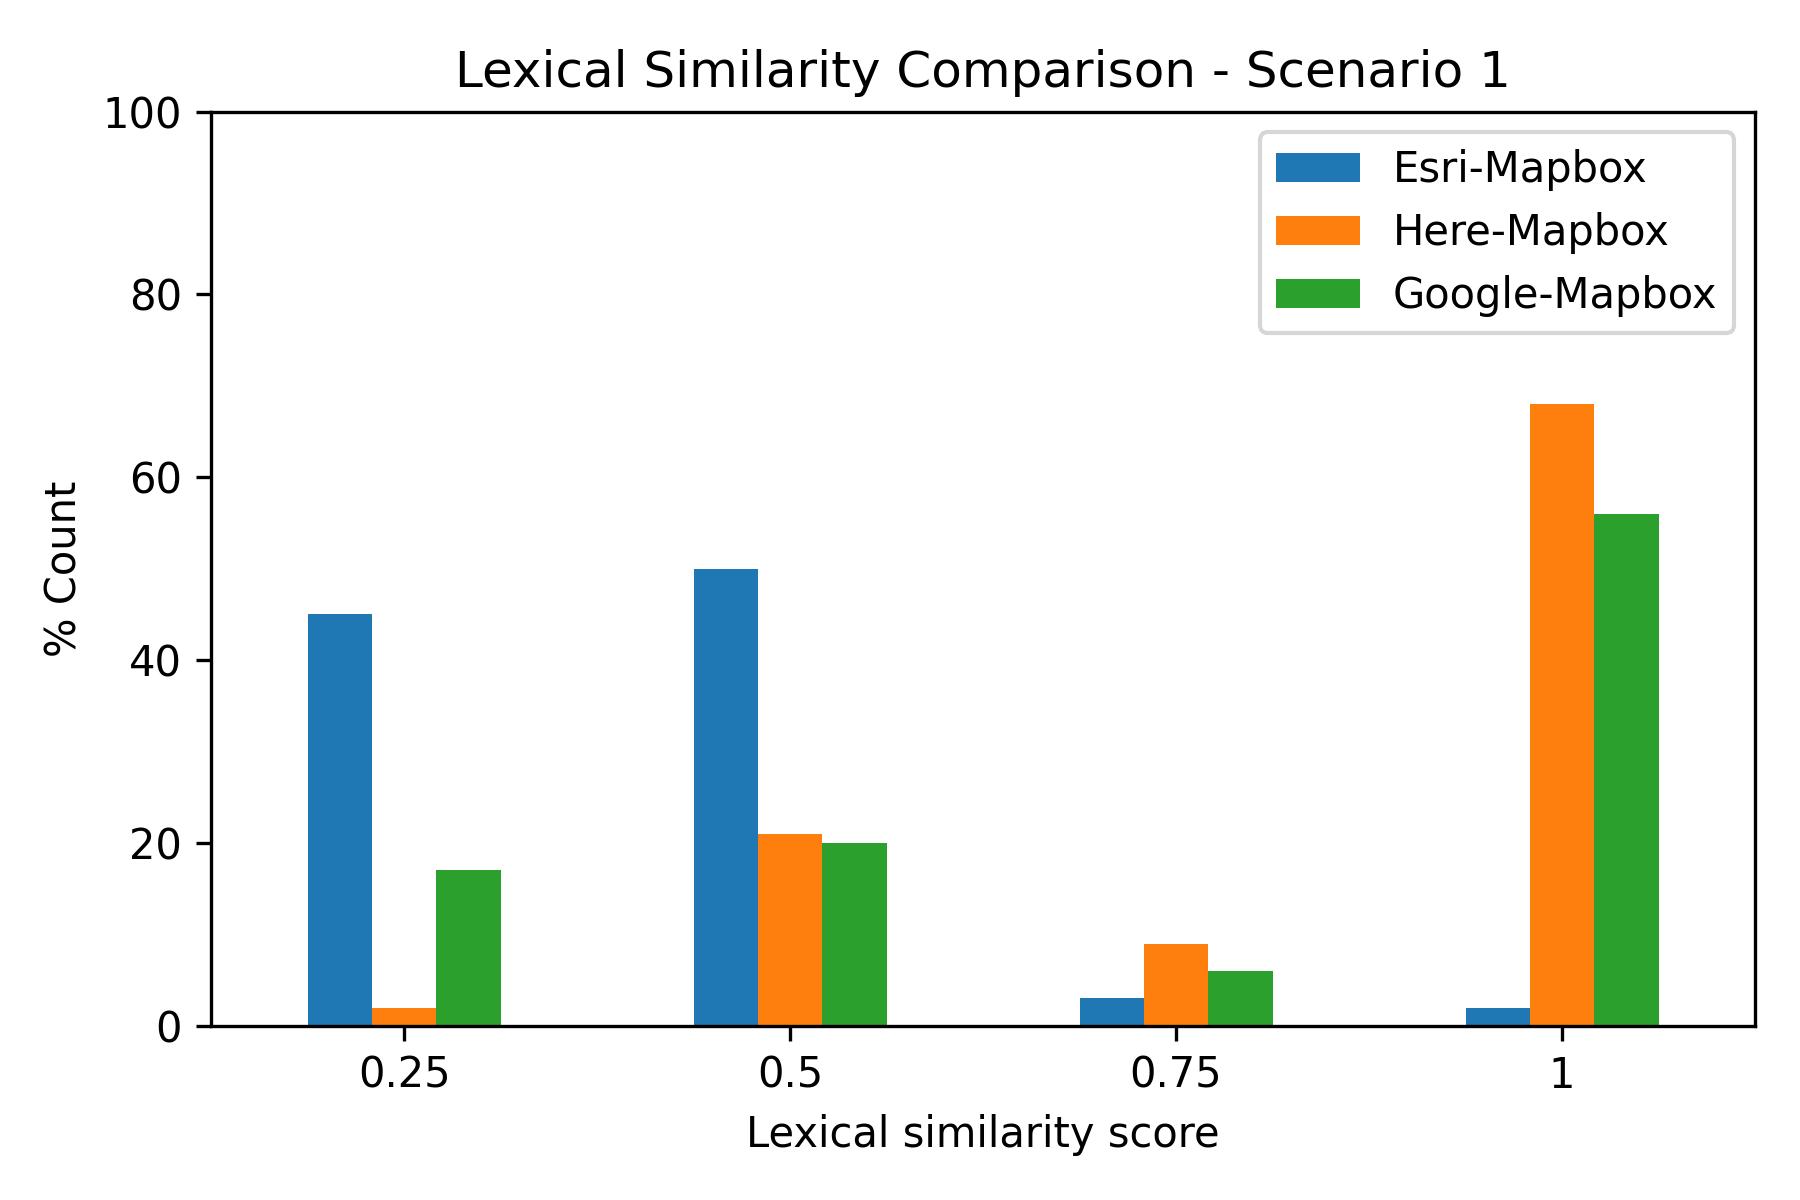
Analysis showed Mapbox's address labels closely aligned with HERE's results in Scenario 1, with even stronger similarities in subsequent scenarios (median pairwise scores above 0.82). Mapbox showed the least similarity to Esri across all scenarios.
| Comparison | Scenario | Min | Max | Mean | Std Dev | Median |
|---|---|---|---|---|---|---|
| Esri-Mapbox | 1 | 0.000 | 0.867 | 0.245 | 0.219 | 0.305 |
| HERE-Mapbox | 1 | 0.000 | 0.940 | 0.736 | 0.229 | 0.863 |
| Google-Mapbox | 1 | 0.000 | 0.942 | 0.609 | 0.340 | 0.808 |
| Esri-Mapbox | 2 | 0.325 | 0.872 | 0.775 | 0.089 | 0.796 |
| HERE-Mapbox | 2 | 0.000 | 0.940 | 0.840 | 0.155 | 0.885 |
| Google-Mapbox | 2 | 0.000 | 0.942 | 0.850 | 0.101 | 0.877 |
| Esri-Mapbox | 3 | 0.382 | 0.872 | 0.733 | 0.128 | 0.777 |
| HERE-Mapbox | 3 | 0.000 | 0.940 | 0.803 | 0.184 | 0.871 |
| Google-Mapbox | 3 | 0.427 | 0.942 | 0.812 | 0.125 | 0.854 |
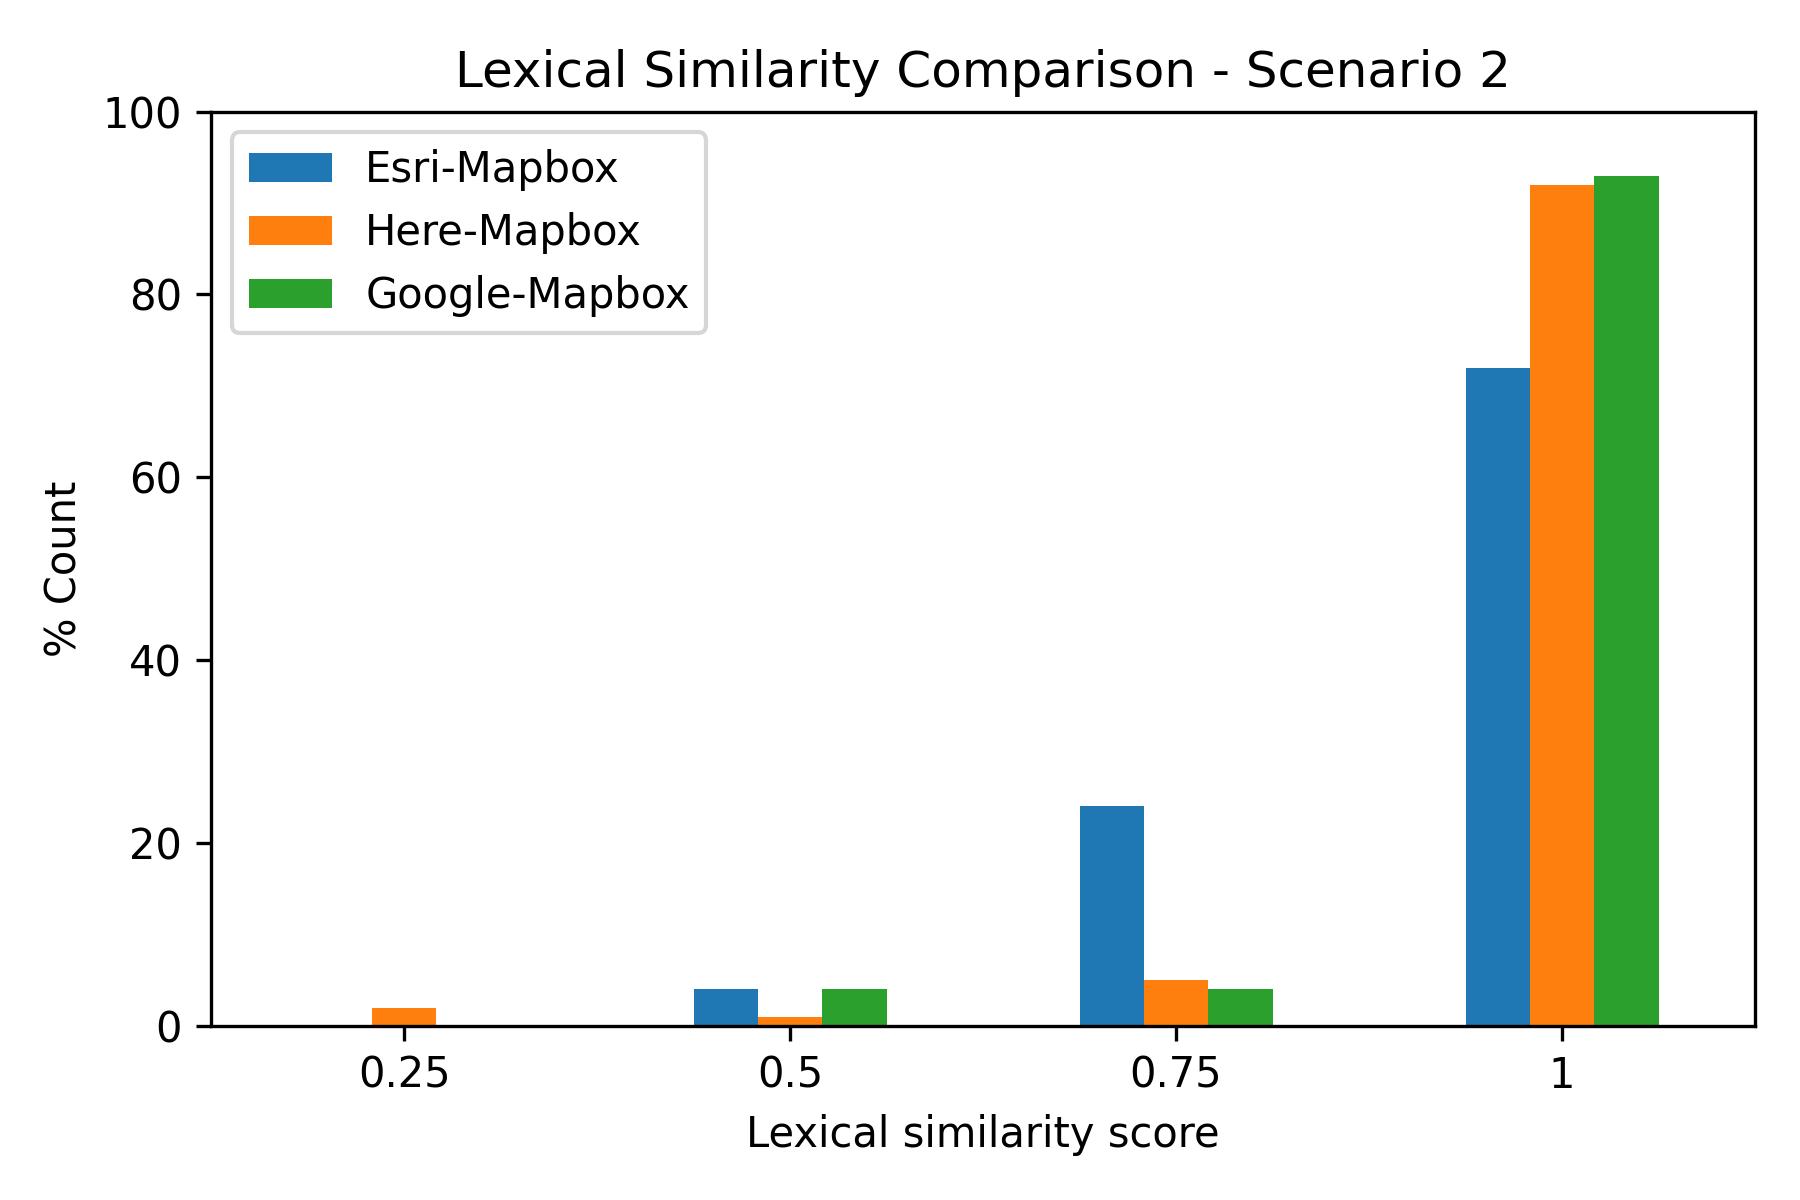
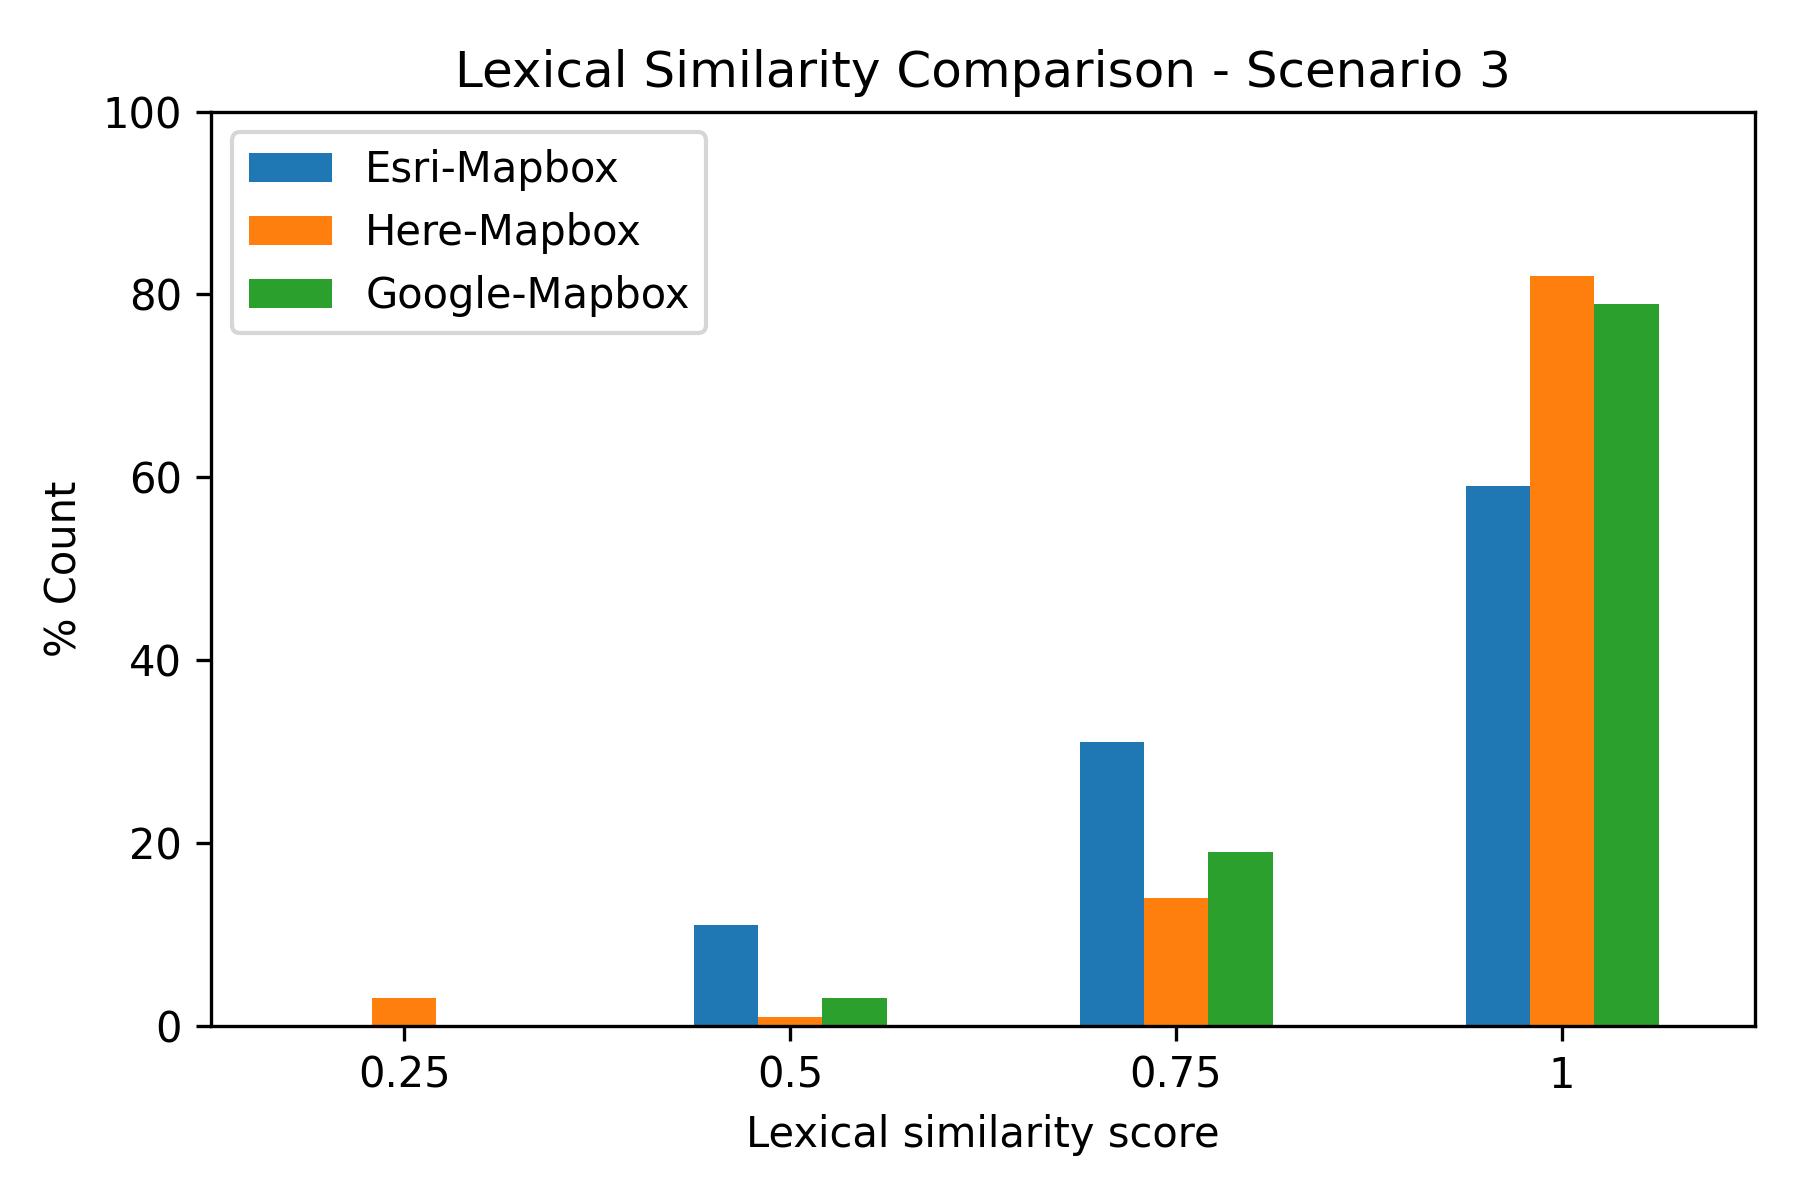
The results demonstrated:
- High consistency between HERE and Mapbox in address formatting
- Strong correlation in normalized address components
- Significant variations in how different providers handle address normalization
Key Findings
- Match Rate Performance:
- HERE and Mapbox excel with incomplete addresses
- All providers perform well with complete addresses
- Esri requires more complete address information for optimal results
- Positional Accuracy:
- Google leads in accuracy with incomplete addresses
- Esri and Google show best results with complete addresses
- Address completeness significantly impacts accuracy across all providers
- Address Label Quality:
- HERE, Google, and Mapbox maintain consistent performance
- Esri excels with complete address information
- All providers handle common misspellings effectively
Conclusion
For PickYourPlace, match rate and lexical accuracy are crucial metrics. While Mapbox's current performance meets our needs, this analysis reveals the strengths of different providers. Each project should evaluate geocoders using representative data specific to their use case, as unique characteristics like address formats or geographic coverage can significantly impact performance.
Why not build our own geocoder? Because it's complex:
- Parsing varied input formats is challenging
- Maintaining current reference data is resource-intensive
- Processing multiple data sources is costly and time-consuming
Maybe someday, but for now, we'll stick with proven solutions. I've shared the code for this analysis in a GitHub repository, though it currently only includes two geocoders. You can use it as a template to evaluate other providers and geographies based on your specific needs.